Feature-rich Dashboard - Copy this Html, Bootstrap Component to your project
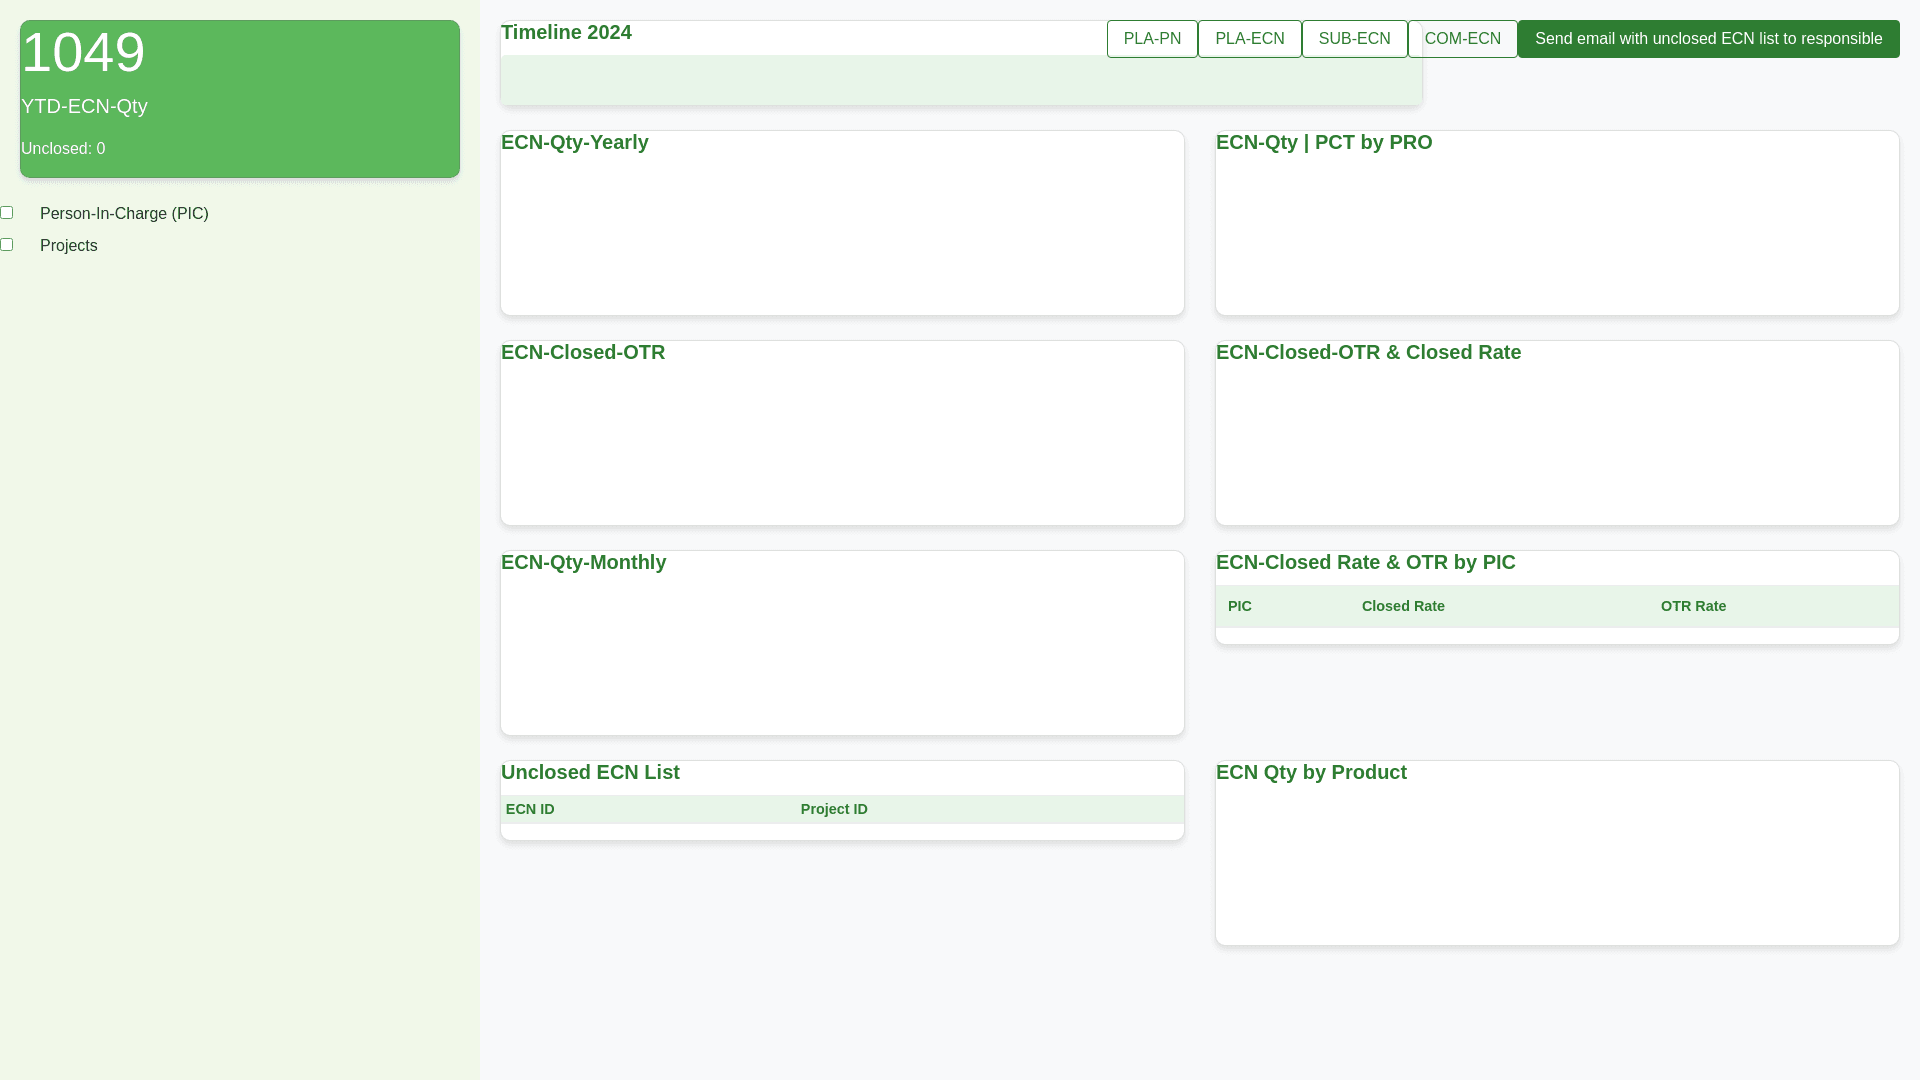
### **General Layout** The dashboard is composed of several cards and charts, organized in a grid layout. Most charts and data are enclosed in well defined sections with consistent use of green shades. The sections are labeled appropriately. **Grid Layout:** **Left Sidebar (1/4 width):** The top left shows a green card with the following data: `1049`, "YTD ECN Qty", and "Unclosed: 0". Below this, checkboxes for **PIC** (Person In Charge) and **Projects**. **Main Content Area (3/4 width):** Multiple charts and stats are arranged in a responsive grid fashion across this area. ### **Top Section (Main Content)** 1. **Timeline:** A simple horizontal timeline showing the year 2024 divided into quarters (Q1 to Q4), with a marker on each month. 2. **Action Buttons (Top Right):** Four buttons labeled: PLA PN PLA ECN SUB ECN COM ECN On the far right is a large green button: "Send email with unclosed ECN list to responsible". ### **Middle Section** 1. **ECN Qty Yearly (Line Chart):** A line graph showing the decline of "ECN Qty" from 2020 to 2024. Values: 4129 (2020), 3046 (2021), 2145 (2022), 2013 (2023), 1049 (2024). 2. **ECN Qty | PCT by PRO (Bar Chart):** Horizontal bar chart indicating ECN quantities per project or product (PRO), with percentages. Examples: YYFPPM11 – 193 ECN | 18%, GATEWAY – 154 ECN | 15%, etc. 3. **ECN Closed OTR (Donut Chart):** A donut chart displaying the closed OTR percentage: **95.52%**. 4. **ECN Closed OTR & Closed Rate (Radar Chart):** A radar chart displaying **Closed Rate** and **Closed OTR** for each PIC (Person in Charge). Names: Agatha, Hu, Jin J, Kimi, Liu, Miya, Nathan, Zhao. ### **Bottom Section** 1. **ECN Qty Monthly (Line Chart):** Another line graph showing monthly ECN quantities for 2024, starting with a peak at **230** in January and ending with **119** in June. 2. **ECN Closed Rate & OTR by PIC (Table):** A table showing closed ECN and OTR rate for each PIC. Each PIC has 100% closed rate and OTR percentages between 93% to 97%. Names: Agatha, Hu, Jin J, Kimi, Liu, Miya, Nathan, Zhao. 3. **Unclosed ECN List (Table):** A small table listing ECN IDs and corresponding Project IDs. This list is empty or not populated in this instance. 4. **ECN Qty by Product (Pie Chart):** A pie chart breaking down ECN quantities by product. Example segments: Pipes (268), Automation (203), Fra... (152), Walkways (109). ### **Design Specifics** **Typography:** Bold numbers for large stats (e.g., "1049"). Consistent use of sans serif fonts for clarity. **Color Scheme:** The dashboard is mostly in shades of green with occasional white backgrounds. Graphs and charts utilize a mix of green and gray for contrast. **Icons & Labels:** Upward pointing arrows beside the closed rate values indicating positive results. Clear and consistent use of labels for each chart and table. ### **Technical Suggestions** 1. **Charts Library:** You can use a JavaScript charting library such as **Chart.js** or **D3.js** to render the various charts (line, bar, donut, radar, and pie). 2. **CSS Framework:** A grid based CSS framework like **CSS Grid** or **Bootstrap** can help with the responsive layout of this dashboard. 3. **State Management (React):** If you're using React, you can manage the data and dynamically update the charts using **useState** and **useEffect** hooks, along with **Axios** for any API calls to get the data. 4. **Email Button Logic:** The "Send email" button could trigger a modal for input or trigger an API call to send the ECN list to the responsible parties. This should give you a complete guide to building this dashboard page.