KPSL
K P Singh Lodhi
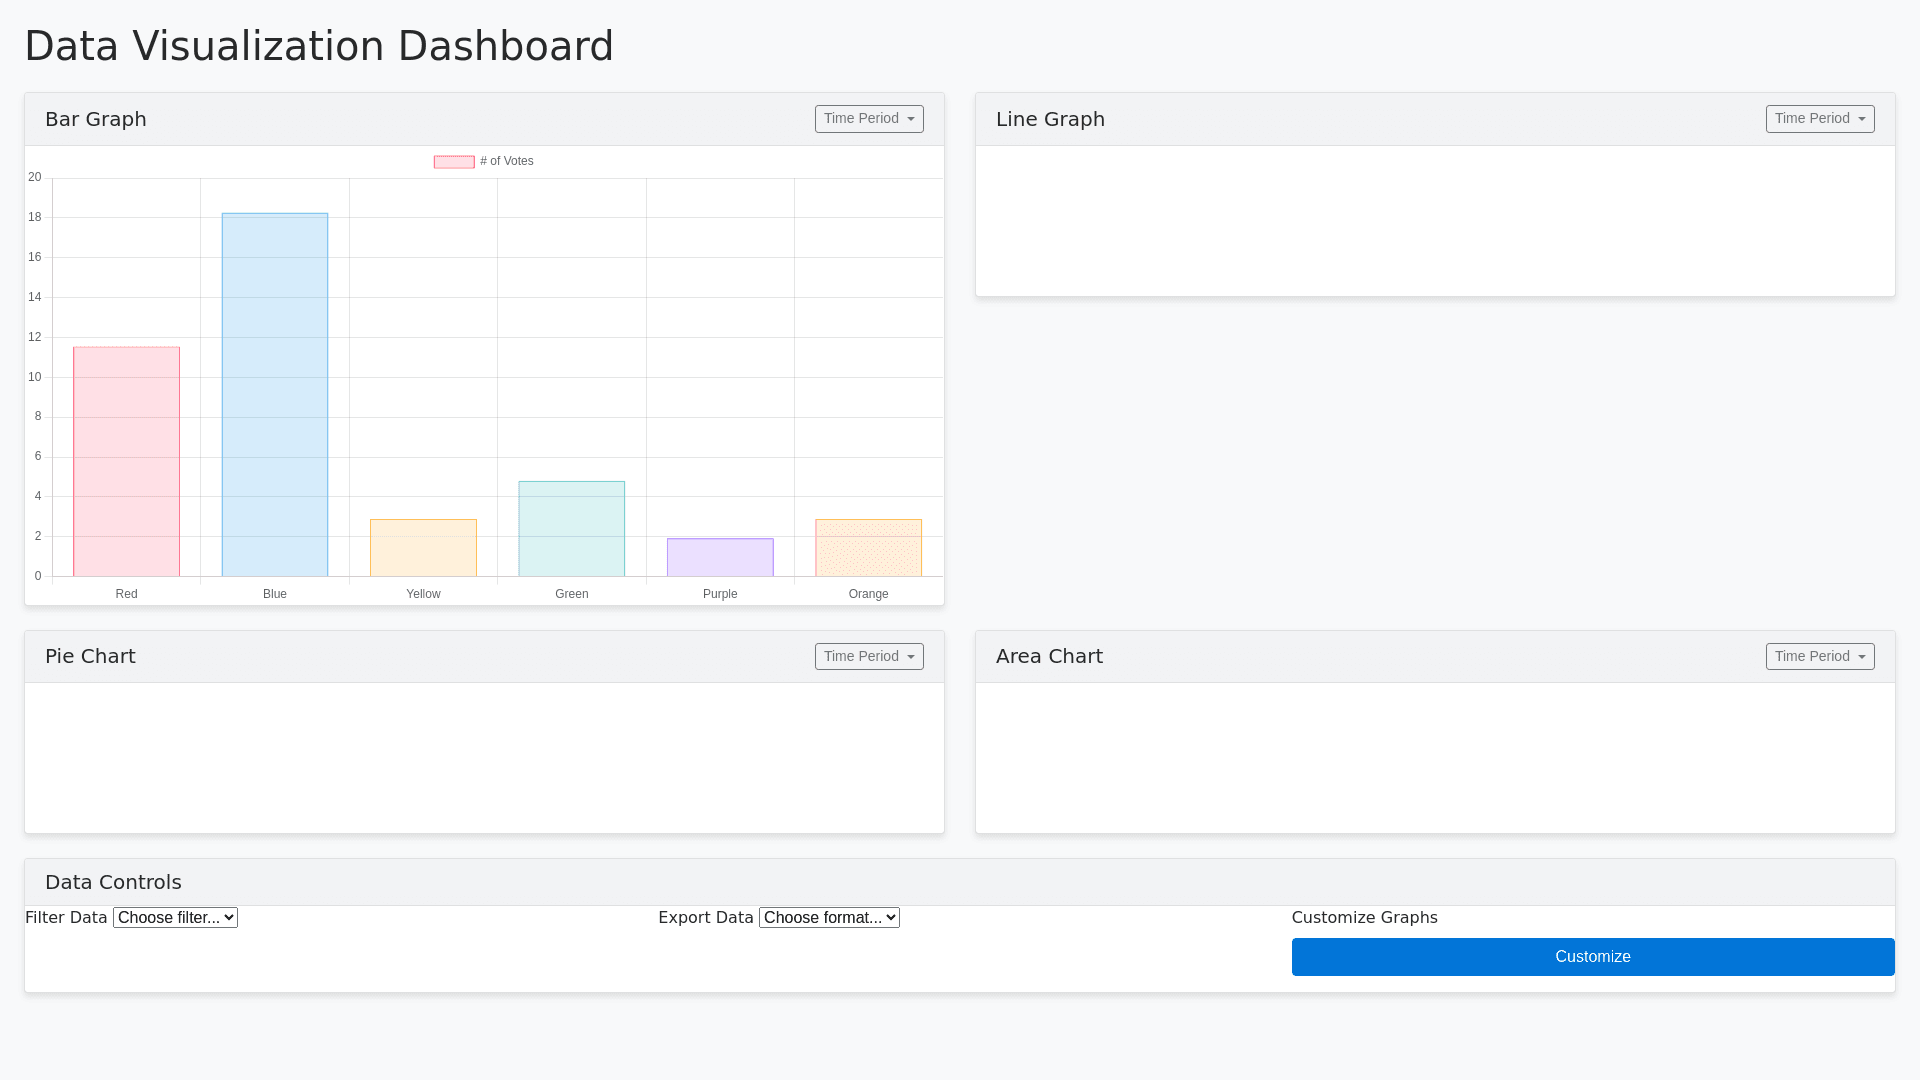
Data Visualization Dashboard - Copy this Html, Bootstrap Component to your project
Can you add time peroid select to month, week, year as group by for each graph and make UI more attractive and responsive
Prompt
Can you add time peroid select to month, week, year as group by for each graph and make UI more attractive and responsive