A
Anonymous
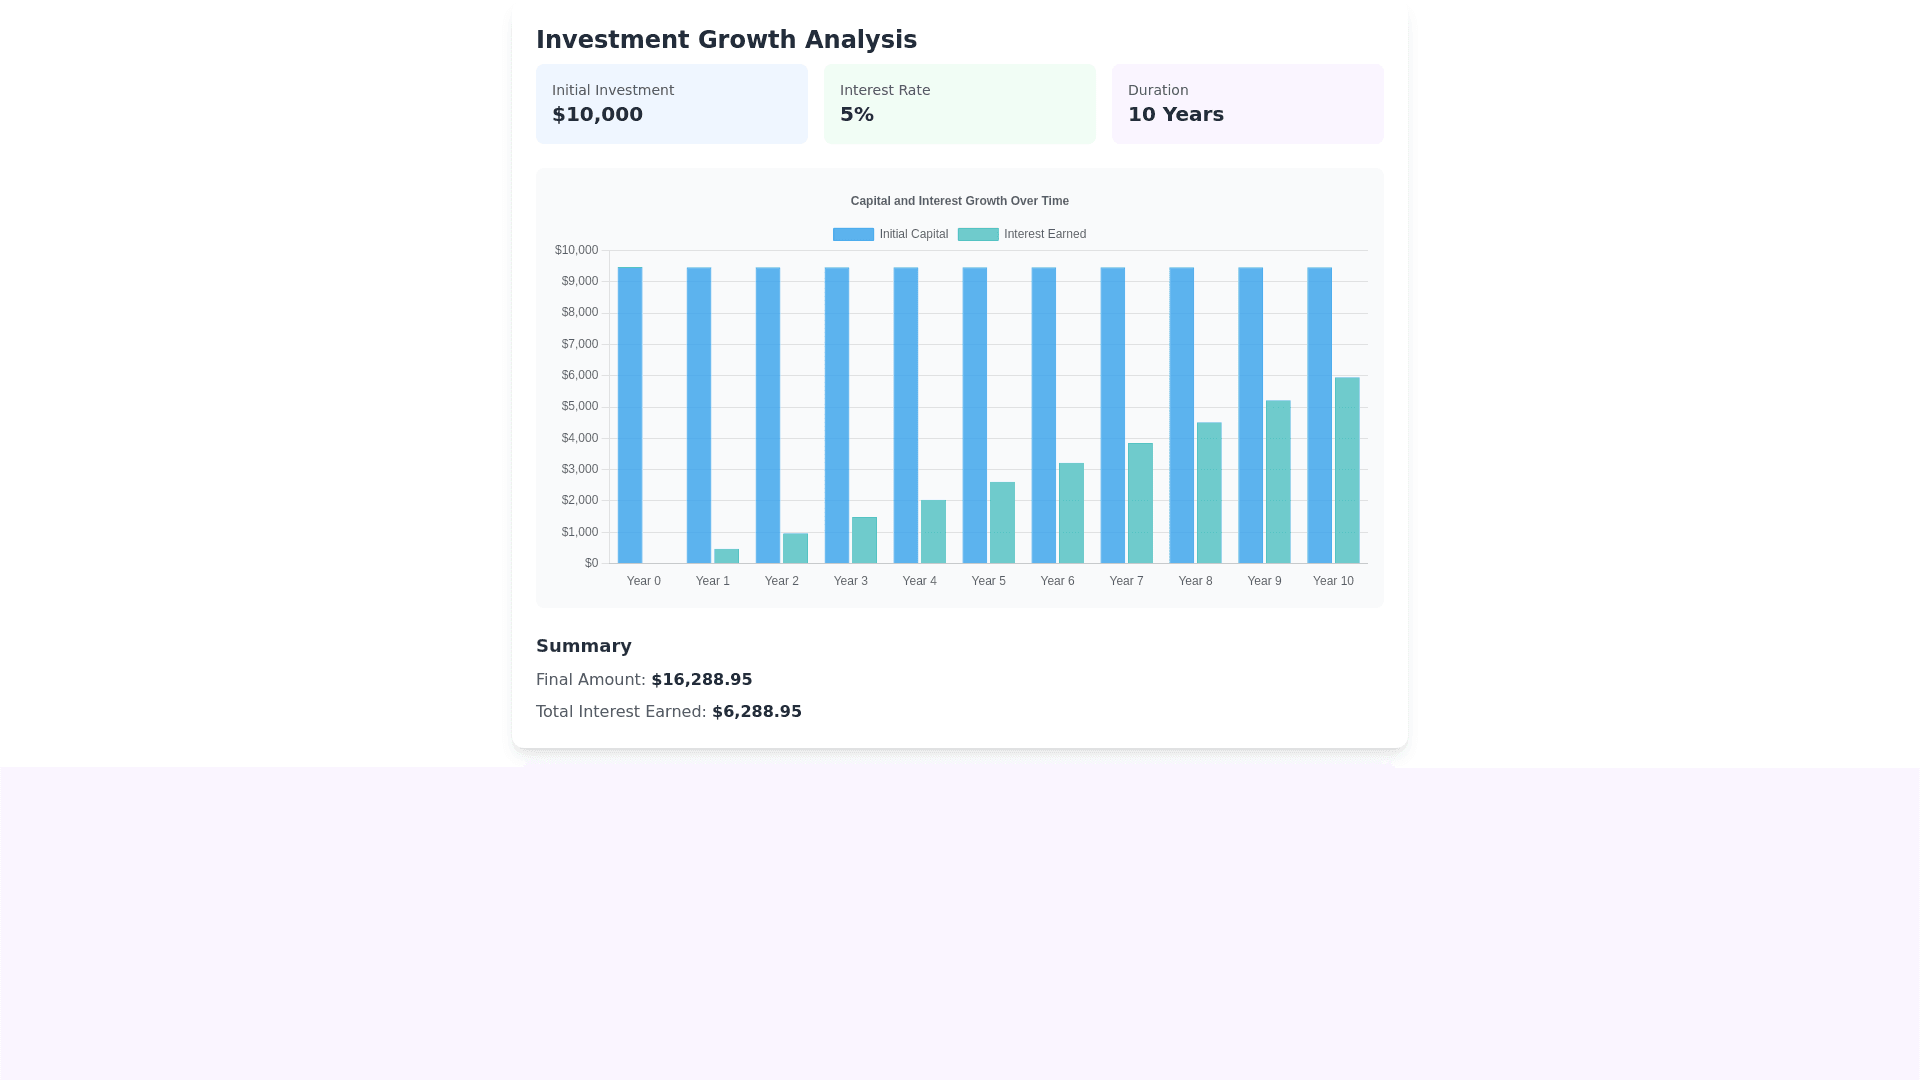
Result Display - Copy this React, Tailwind Component to your project
How-to-modify-this-code-to-display-the-amount-of-capital-and-interest-on-the-same-graph-bar-:-type-ChartDataDisplayProps-=-{-x:-number;-y:-number;-};-export-function-ResultDisplay({-formvalues,-}:-ResultDisplayProps):-React.JSX.Element-|-null-{-const-{-duration-}-=-formvalues;-//-Generate-chart-data-for-each-year-const-generateChartData-=-():-ChartDataDisplayProps[]-=>-{-const-data:-ChartDataDisplayProps[]-=-[];-for-(let-year-=-1;-year-<=-duration;-year++)-{-const-y-=-calculateCompoundInterest({-...formvalues,-duration:-year-});-console.log(`Year:-${year},-Cumulative-Total:-${y}`);-data.push({-x:-year,-y-});-}-return-data;-};
Prompt