Landing Page - Copy this React, Tailwind Component to your project
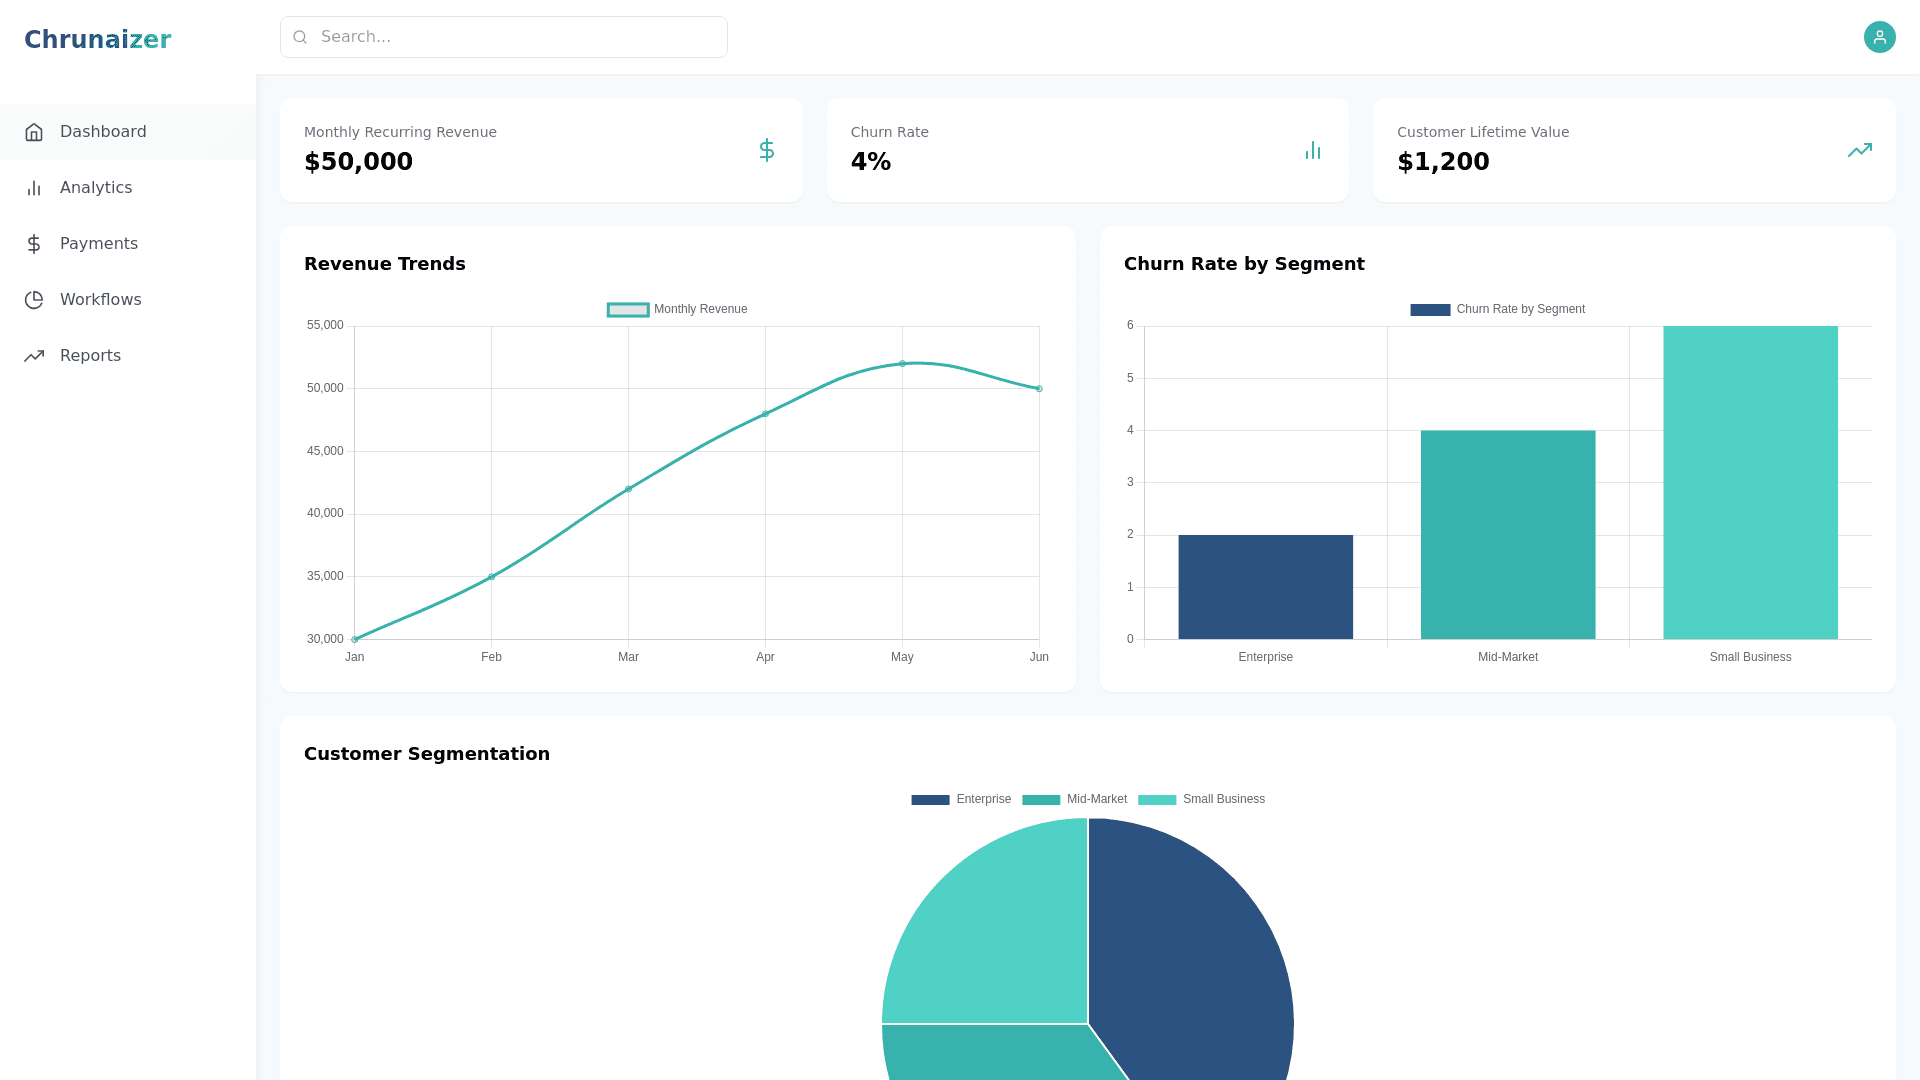
Design a personalized dashboard for a SaaS platform called Chrunaizer, which focuses on revenue optimization. The dashboard should display key performance indicators (KPIs) at the top, such as Monthly Recurring Revenue (MRR), Churn Rate, and Customer Lifetime Value (CLTV). Below the KPIs, include interactive charts and graphs, such as a line graph for revenue trends, a bar chart for churn rate, and a pie chart for customer segmentation. Add a navigation sidebar on the left with links to other sections like 'Dashboard,' 'Analytics,' 'Payments,' 'Workflows,' and 'Reports.' Include a header bar at the top with a search bar and a user profile icon. Use a clean and professional design with a blue, white, and teal color scheme, rounded UI components, and smooth hover effects. The layout should be responsive, optimized for both desktop and mobile devices."* Key Elements in the Dashboard KPIs at the Top: "MRR: $50,000" "Churn Rate: 4%" "CLTV: $1,200" Charts Section: Line graph: Monthly revenue trends. Bar chart: Churn rate by segment. Pie chart: Customer segmentation or product usage. Navigation Sidebar: Links: Dashboard, Analytics, Payments, Workflows, Reports. Header Bar: Search bar for quick navigation. User profile icon with a dropdown for account settings.