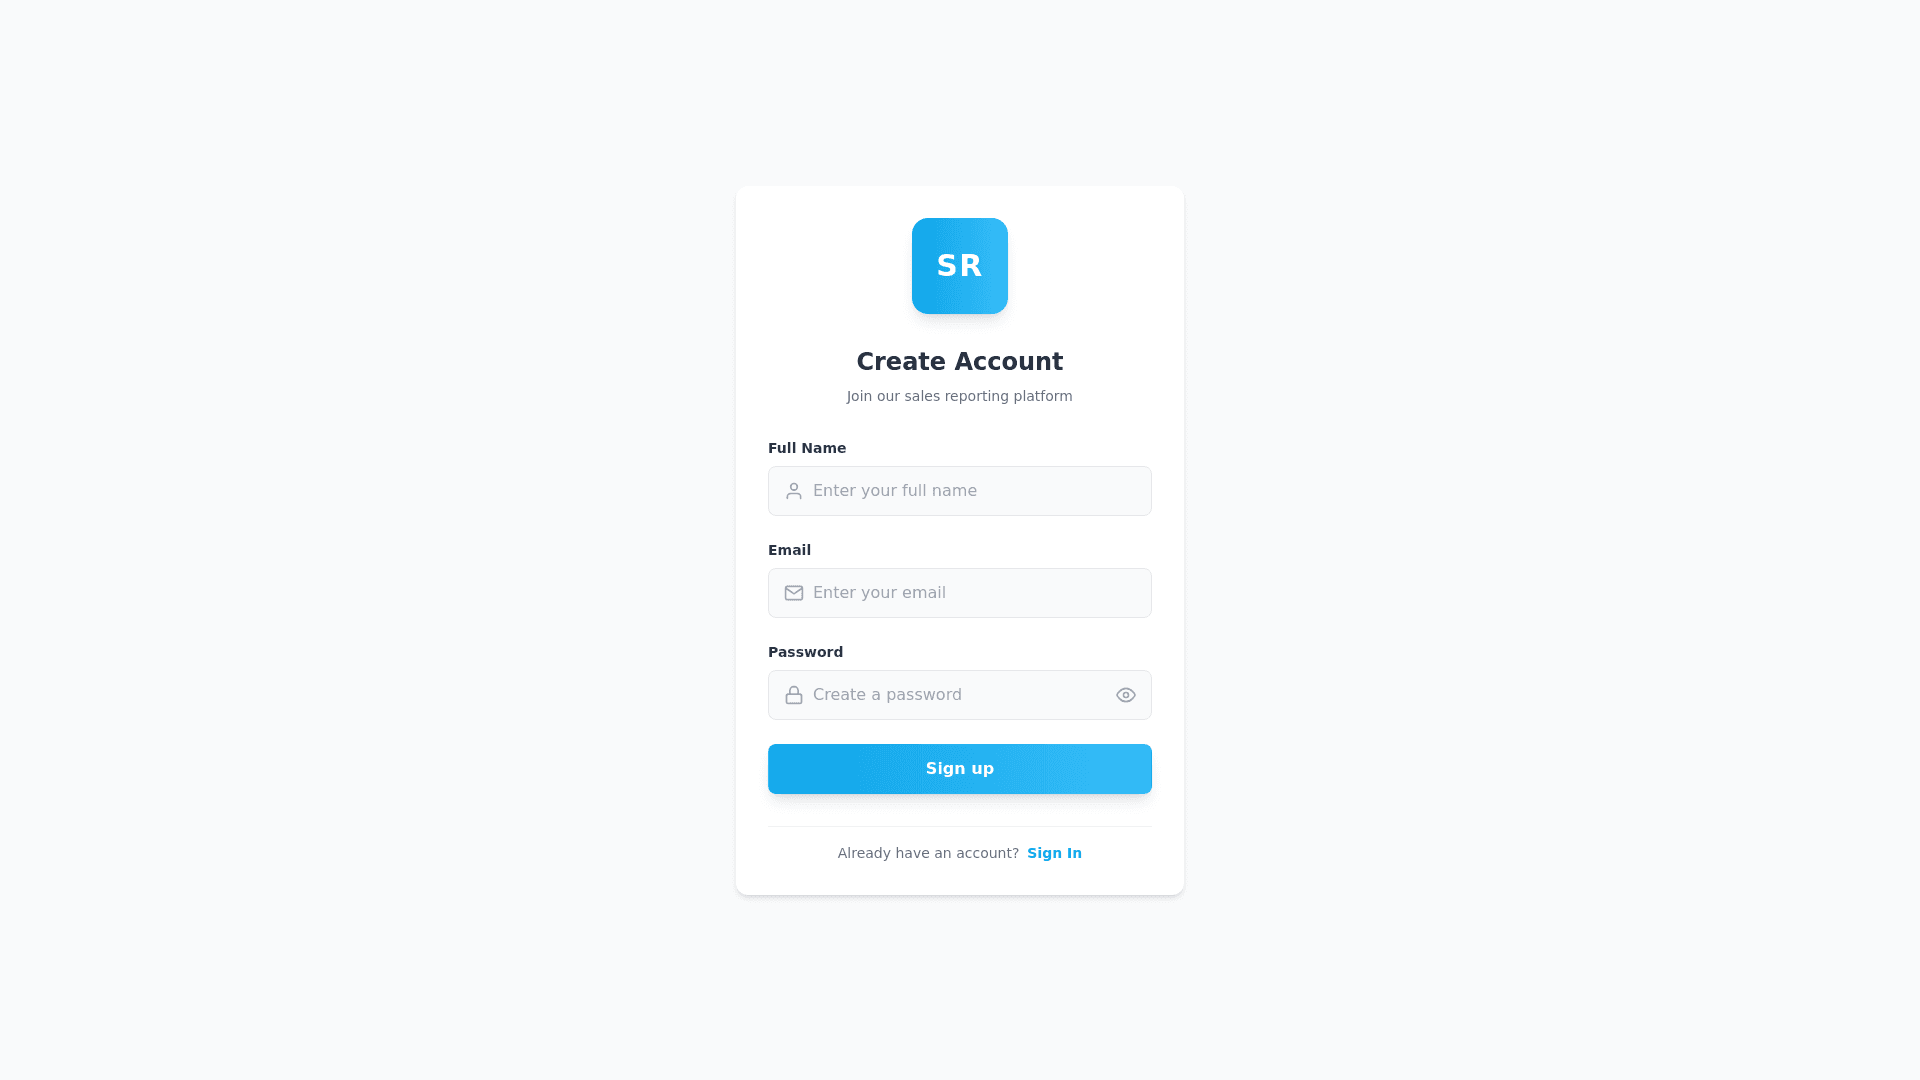
Auth Page - Copy this React, Tailwind Component to your project
In "báo cáo mỗi ngày" – 3-Step Wizard Design a 3-step reporting flow with horizontal progress indicator (step bar at top of screen). Use card components for each step. Step 1 – Select Supermarket & Date Header: “SKU Quantity Report” Subheader: “Select supermarket and report date” Step Indicator: Step 1 (active), Step 2 & 3 grayed Components: Supermarket (TextField with icon) Date (Date Picker with calendar icon) CTA Button: “Continue” (blue gradient, rounded, full-width) Step 2 – Enter SKU Quantities Header: “SKU Quantity Report – [Supermarket Name]” Step Indicator: Step 2 active Features: Search bar (with filter icon) Horizontal scrollable filter tags: All, Roasted, Mix, Fruit, Raw, Flavored List of expandable cards per SKU: SKU Name + Tag On tap: input for quantity Navigation: “Back” (outlined button) “Continue” (blue gradient button with arrow icon) Step 3 – Confirm & Submit Header: “SKU Quantity Report – Confirm Report” Step Indicator: Step 3 active Summary Card: Supermarket + Date Report Table: Columns: SKU | Quantity | Unit Price | Total Price Quantity editable inline (± buttons) Summary Section: Total SKUs and Total Value Actions: “Back” (outlined) “Submit Report” (green filled button with paper-plane icon)
