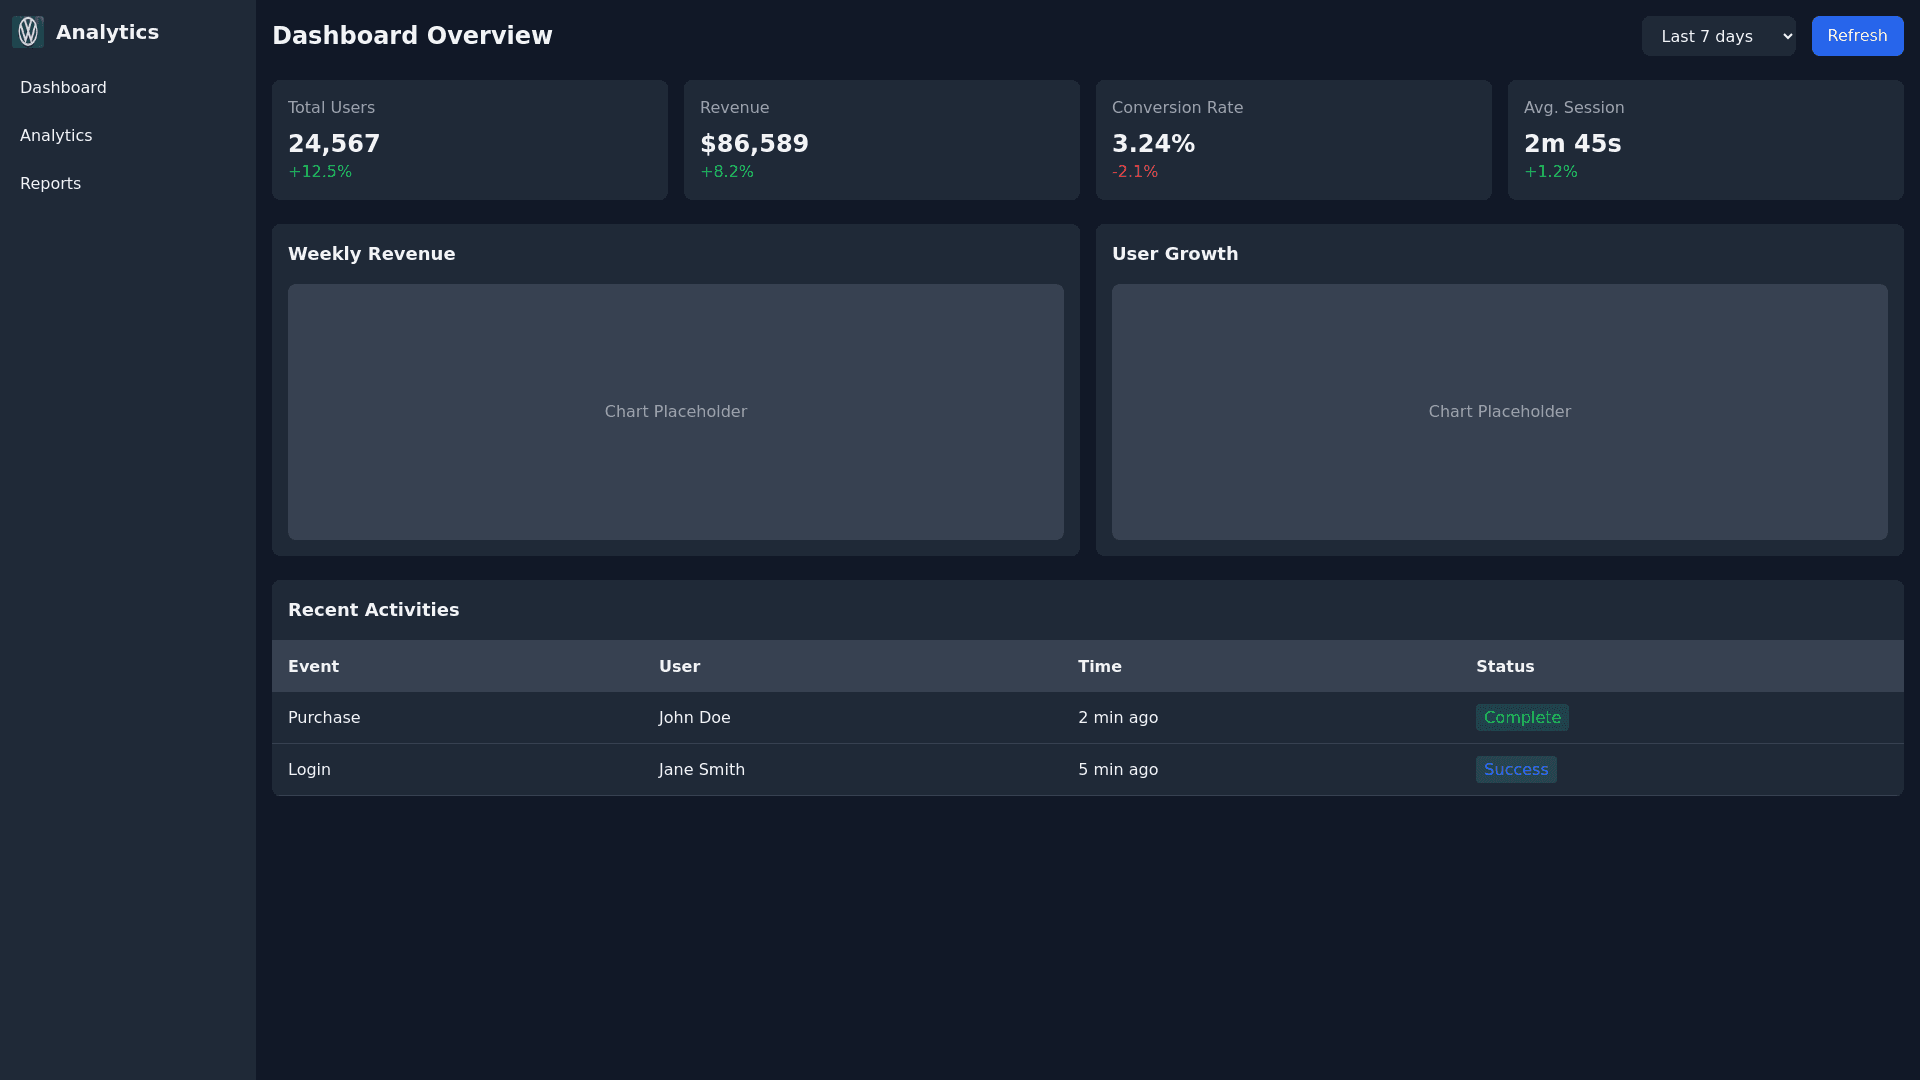
Dark Analytics Dashboard - Copy this Html, Tailwind Component to your project
Create a dashboard to manage data from the following APIs: Weekly Data: http://127.0.0.1:5000/api/weekly?coin=BTC Monthly Data: http://127.0.0.1:5000/api/monthly?coin=BTC Yearly Data: http://127.0.0.1:5000/api/yearly?coin=BTC Requirements: Statistical Charts: Implement charts to visualize data from the above APIs. The charts should be clear and easy to interpret, such as bar charts, line charts, or pie charts depending on the data type. Filtering Functionality: Include filters that allow users to select the time frame (weekly, monthly, yearly) to view corresponding data from the APIs. Add a "Filter" button to apply these selections. User Interface: Design the interface with a dark theme for a modern look. Use contrasting colors to highlight charts and important information. Interactivity: Ensure users can interact with the charts (e.g., zoom in/out, hover for details) and provide options to download data if needed.