Trading Dashboard - Copy this React, Tailwind Component to your project
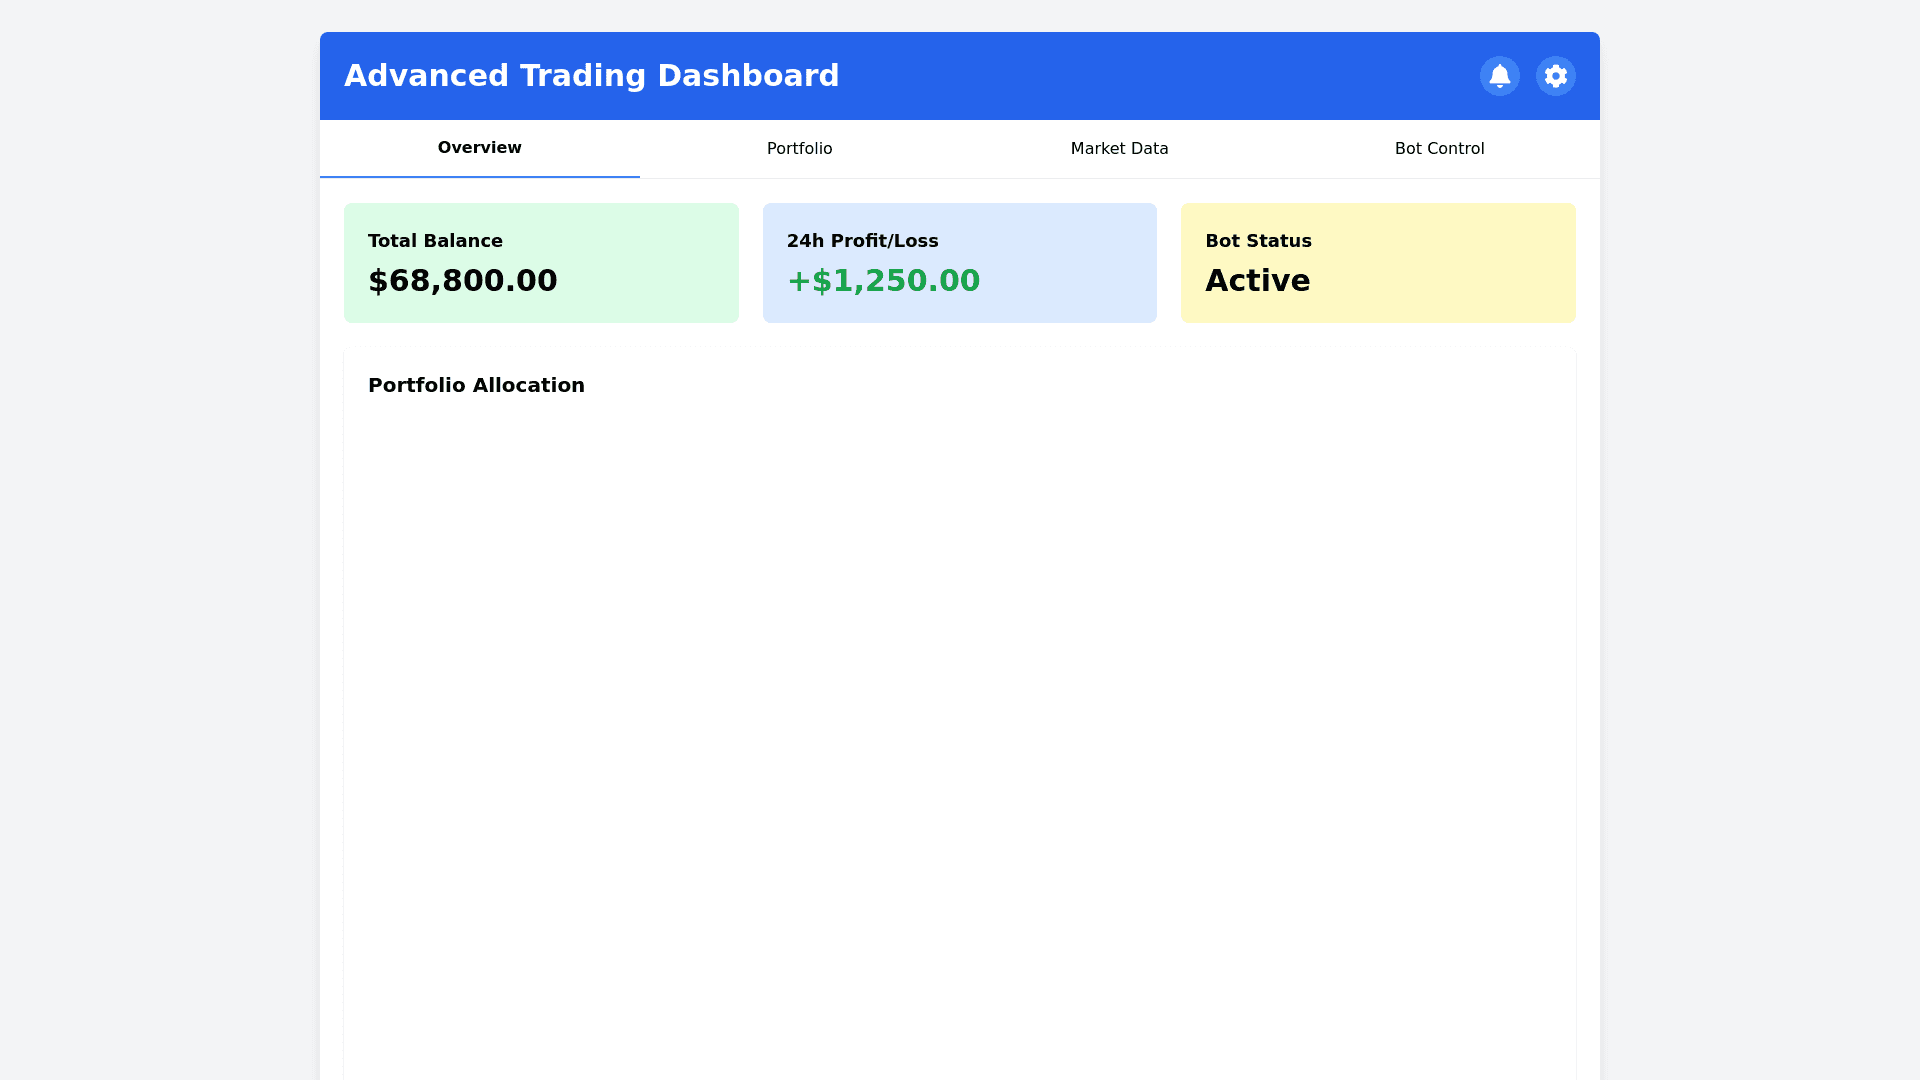
Dashboard Functionality 1. Real-Time Monitoring and Control 1.1. Trading Bot Status Current Status Display: Active/Paused/Stopped: Clearly show the current operational status of the trading bot. Control Buttons: Start/Pause/Stop: Allow users to control the bot's operation directly from the dashboard. Session Logs: Recent Actions: Display a log of recent trades and actions taken by the bot with timestamps. Error Notifications: Highlight any errors or exceptions encountered. 1.2. Portfolio Overview Current Holdings: List all cryptocurrencies held, quantities, average purchase price, and current market value. Portfolio Value: Total Balance: Show total portfolio value in fiat currency and BTC/ETH equivalents. Profit & Loss (P&L): Realized P&L: Profits or losses from closed positions. Unrealized P&L: Potential profits or losses from open positions. Asset Allocation: Visual Representation: Use pie charts or bar graphs to show percentage allocation across assets. 1.3. Market Data and Analytics Real-Time Market Prices: Current prices of tracked cryptocurrencies with percentage change over different time frames. Interactive Charts: Price Charts: Candlestick charts with customizable time frames. Technical Indicators: Overlay indicators like Moving Averages, RSI, MACD. Order Book and Depth Charts: Visualize market depth for selected cryptocurrencies.