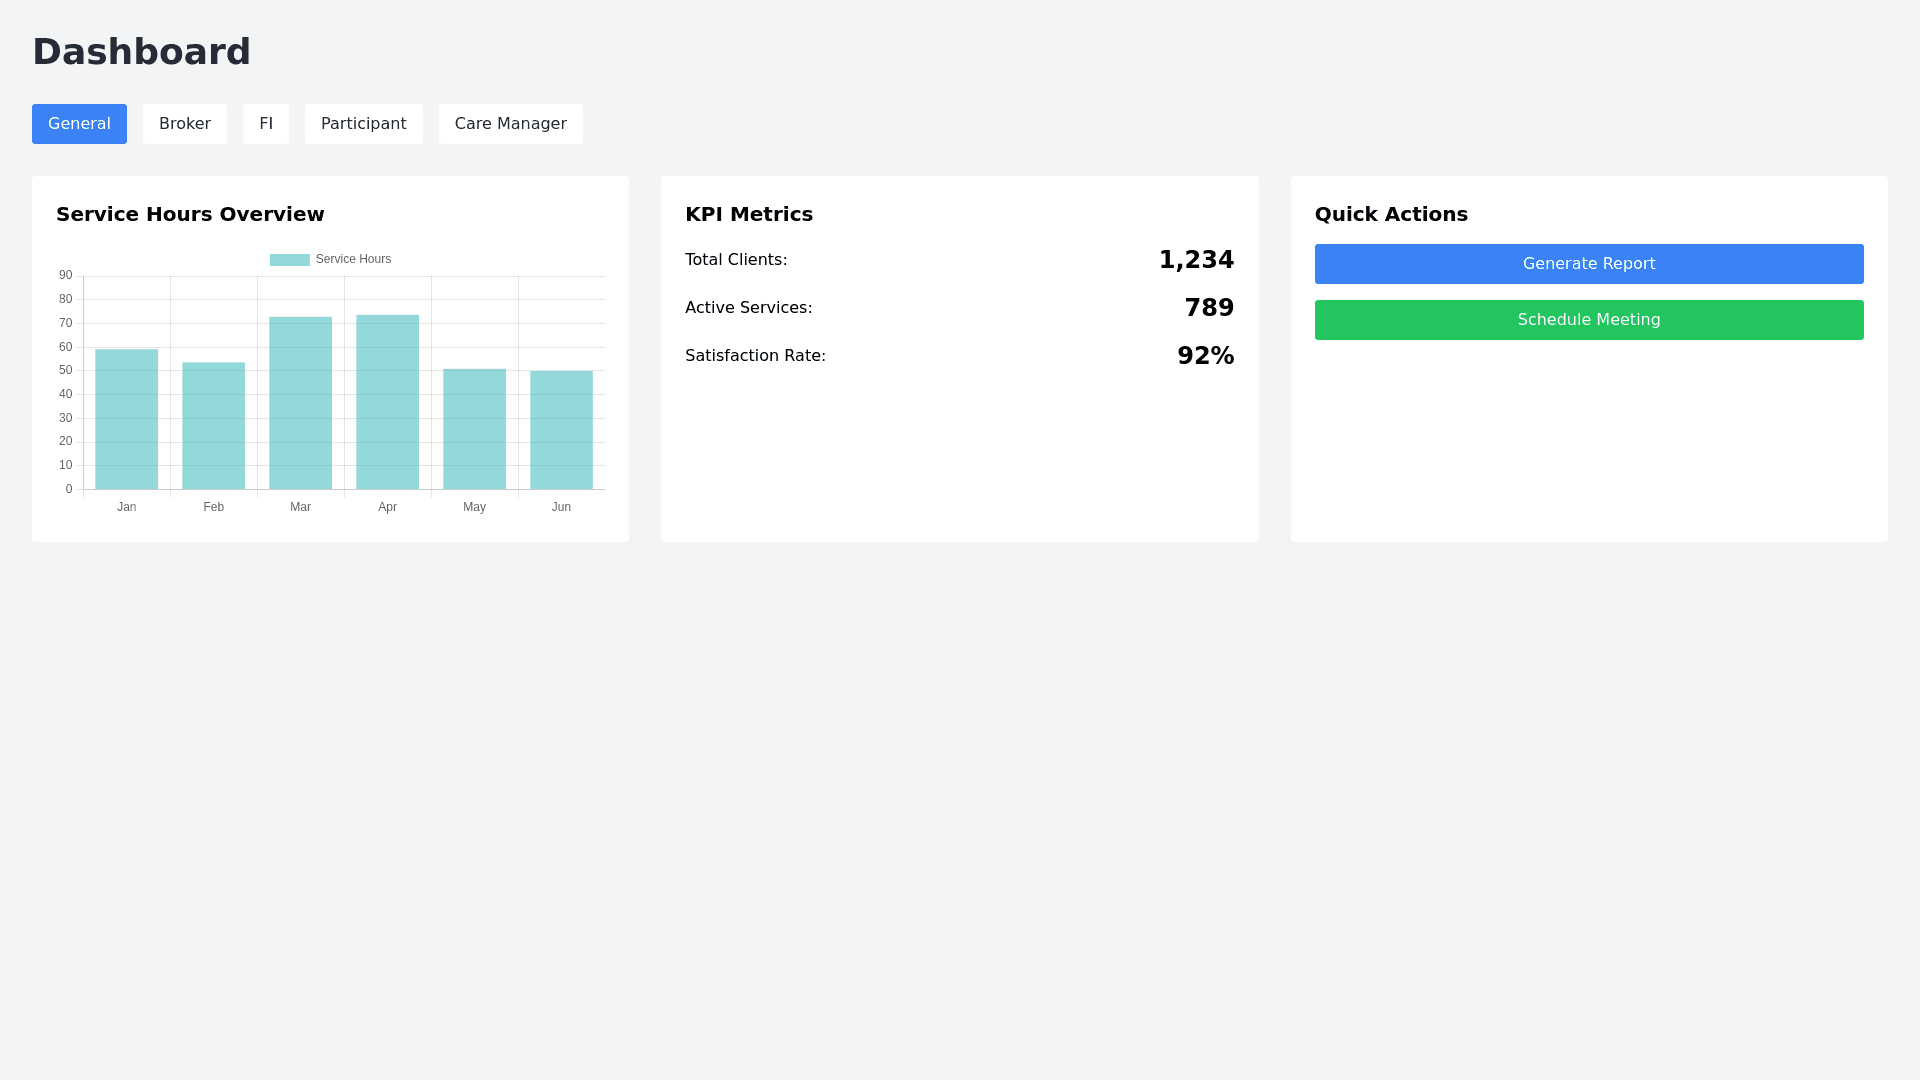
Dashboard - Copy this React, Tailwind Component to your project
General UI: "Create a dashboard layout with KPI metrics (total clients, service hours, reimbursements) and include date filters for daily, weekly, and monthly views." Broker Specific Section: "Design a Broker dashboard with stacked bar charts for service hours, a table displaying missing documentation, and metrics showing inactive clients and total service hours." Fiscal Intermediary (FI) Section: "Create a Fiscal Intermediary dashboard that shows total and pending reimbursements, units billed, and includes a line chart comparing approved vs. used services." Participant Section: "Build a Participant dashboard showing their service hours, reimbursement received, and remaining budget with a line chart for service hours and a bar chart for pending vs completed services." Care Manager Section: "Design a Care Manager dashboard that tracks HCBS waiver enrollment status, pending service change requests, and incident reporting with a pie chart for waiver status and a line chart for service change requests."