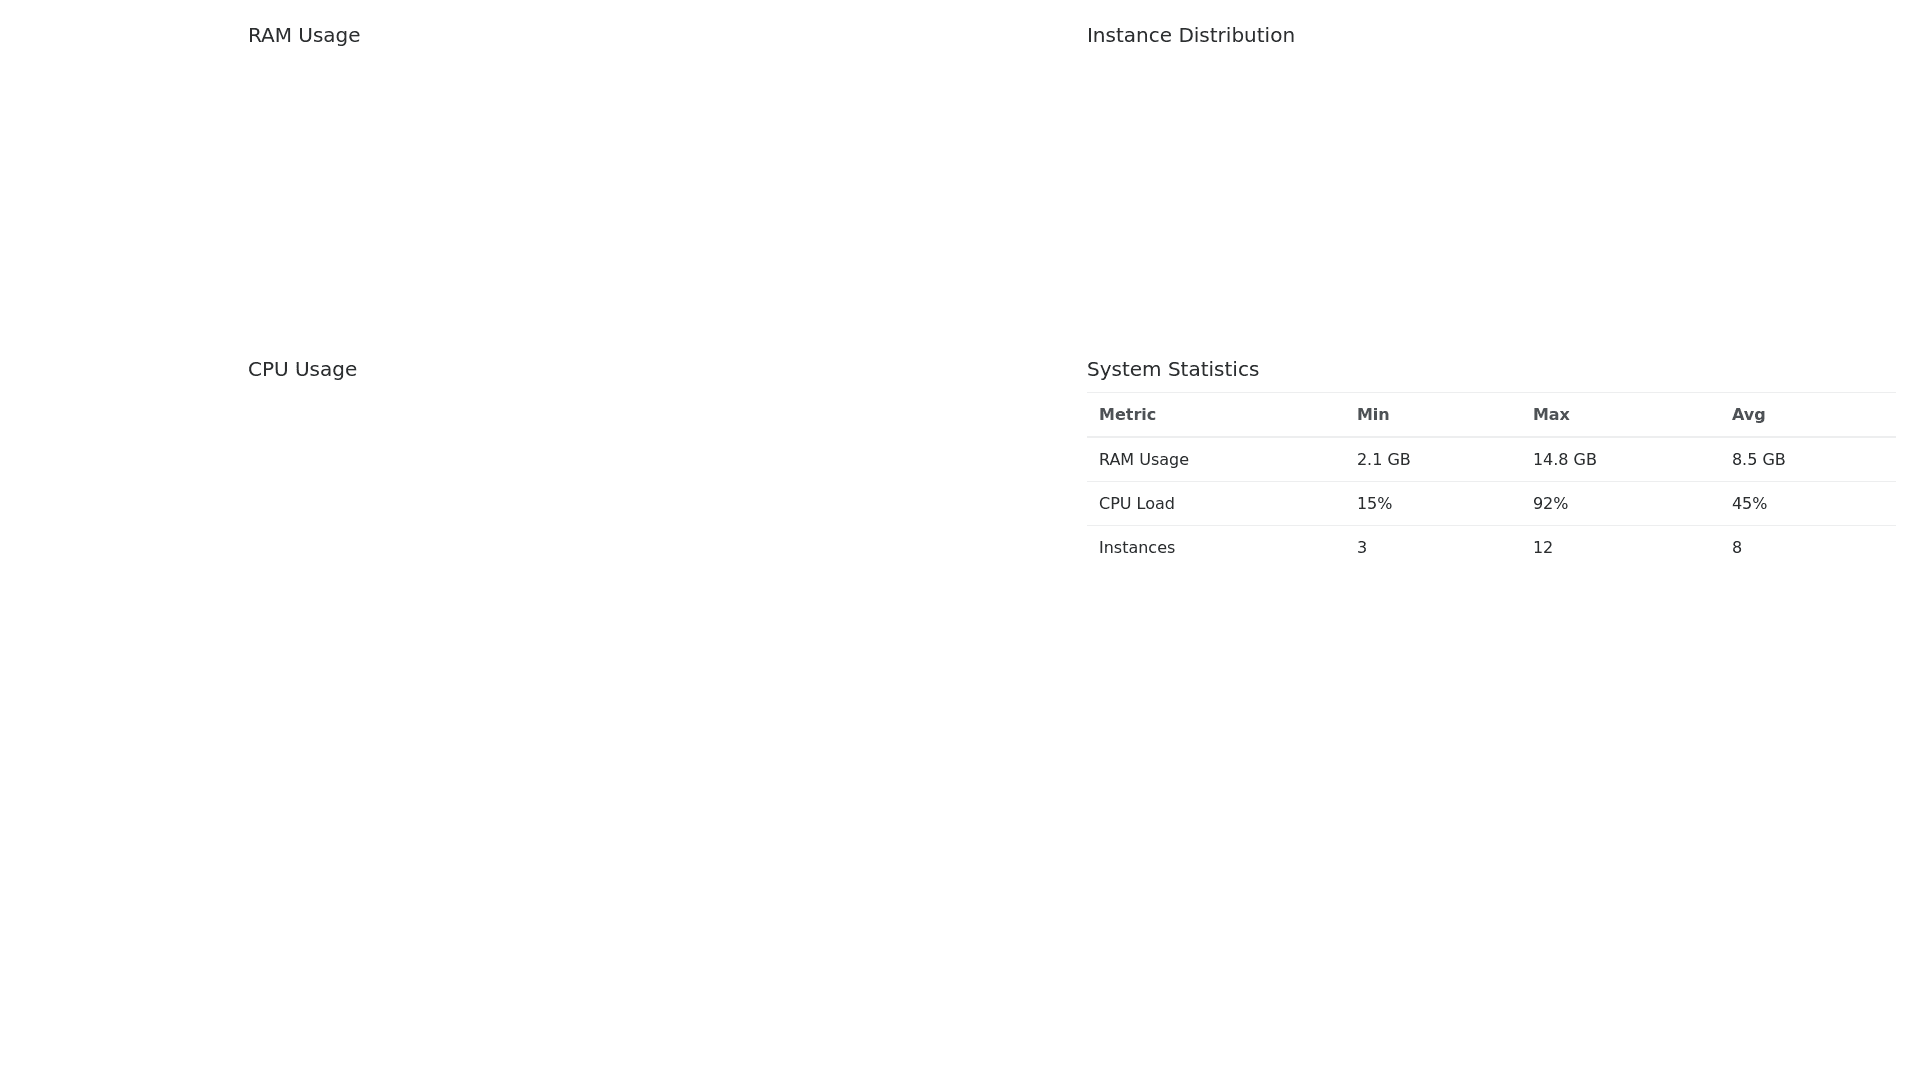
System Metrics Dashboard - Copy this Html, Bootstrap Component to your project
Hello, Could you please design a dashboard using ECharts that includes a sidebar and is suitable for displaying various metrics? Here are the specific requirements: Sidebar Navigation: Include a sidebar that allows the user to navigate between different charts and data views. RAM Usage Chart: Create a chart that displays RAM usage over different time intervals. The chart should be able to effectively show the changes in RAM consumption over time. Instances Chart: Create a chart that displays the count of running machines for each instance type. This will help in tracking the usage of different instance types. Three Charts and One Table: In total, create three charts that are relevant for monitoring system metrics. The first chart should be the RAM usage chart, and the second should show the count of machines per instance type. The third chart could be a line or bar chart that visualizes any other relevant system metric, such as CPU utilization or network bandwidth. Also, include a table that provides statistical data and summaries for these metrics, such as maximum, minimum, and average values. Make sure that the interface is user friendly, with clear legends, labels, and tooltips to enhance usability. Thank you!
