Dashboard - Copy this React, Tailwind Component to your project
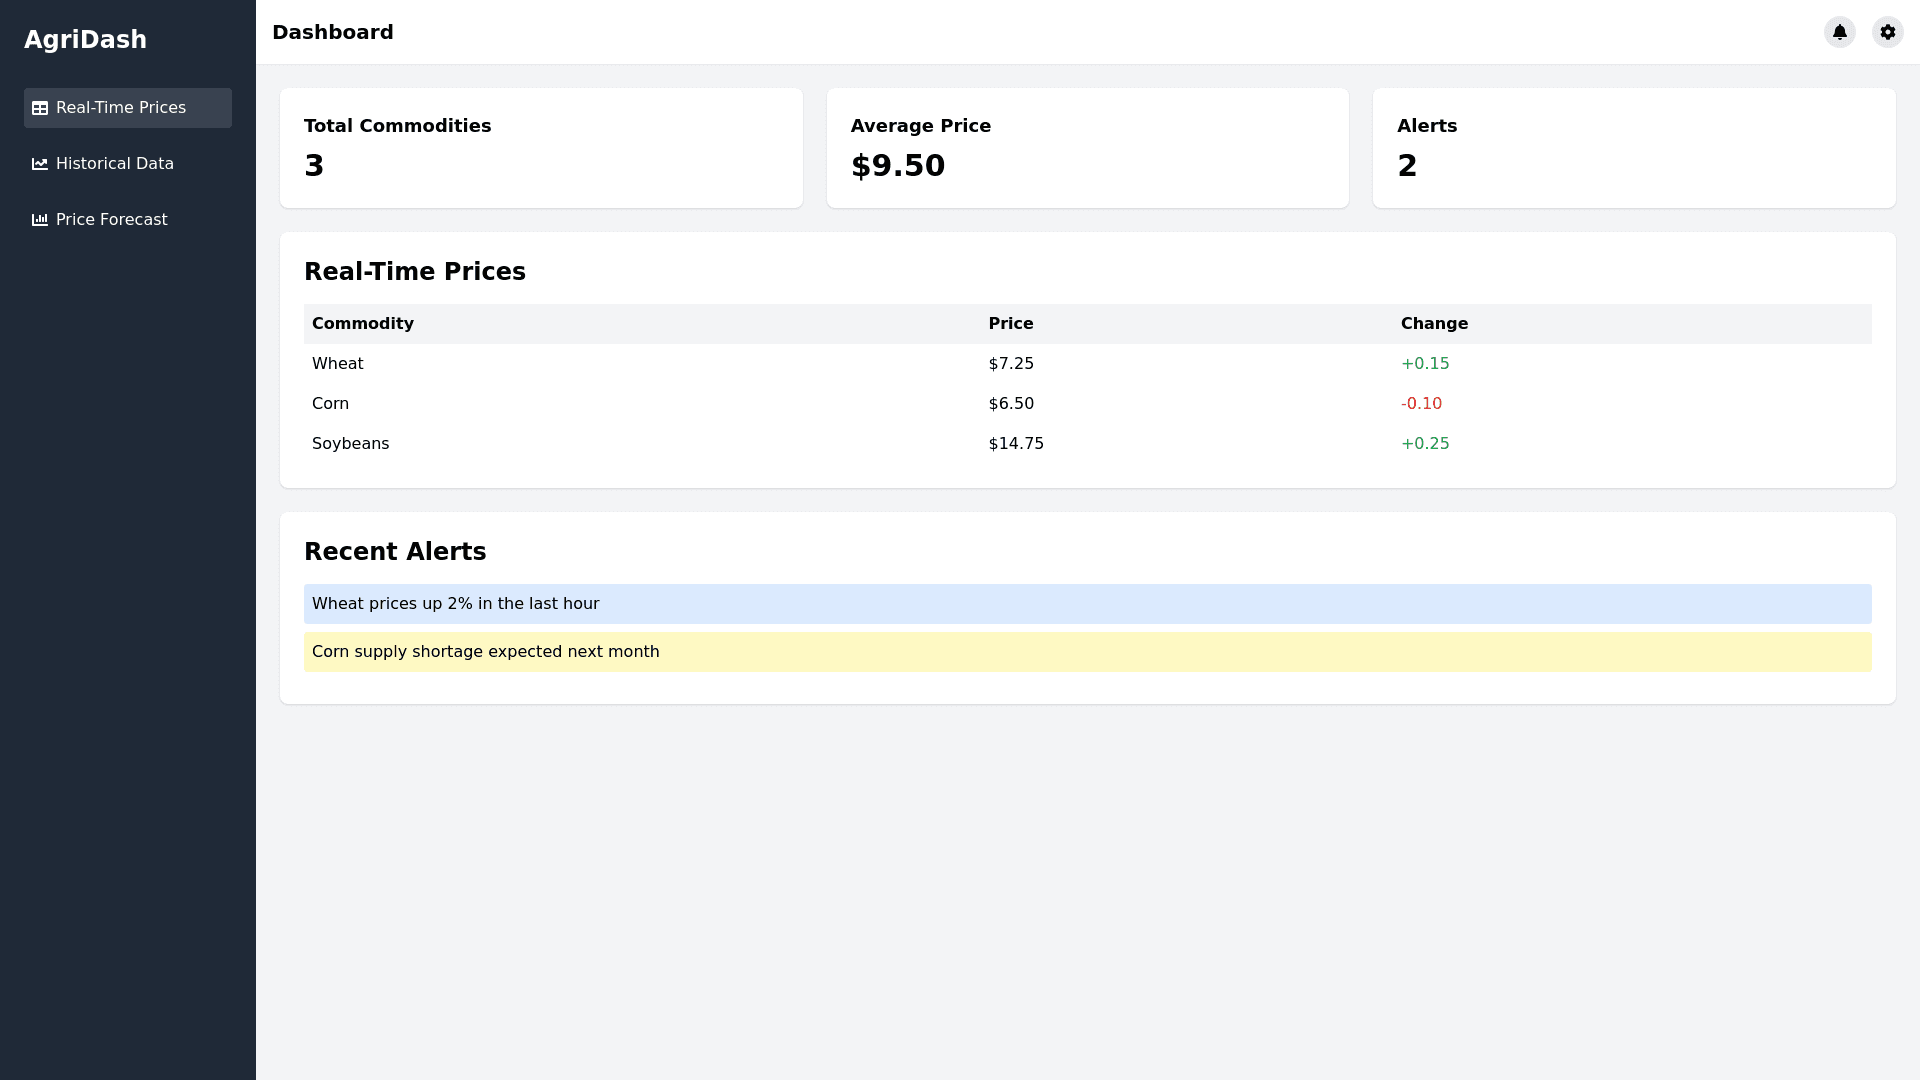
1. Dashboard Page: Layout: Create a clean, intuitive layout with a top navigation bar and a sidebar for quick access to different sections. Widgets and Panels: Real Time Prices: Display current prices of essential commodities in a table format with sorting and filtering options. Historical Data Charts: Include interactive line or bar charts showing price trends over different time periods (daily, weekly, monthly). Forecast Section: Integrate a panel showing predicted prices based on the ensemble model (XGBoost, Prophet, LSTM) with graphical representation. Alerts and Notifications: Add a widget for real time market alerts and notifications about significant price changes or events. Customizable Views: Provide options for users to select specific commodities, regions, and timeframes. Dynamic Features: Ensure data is updated in real time, and include interactive elements for users to drill down into detailed views. 2. Price Prediction Tool: Interface: Design an interactive form where users can input parameters such as weather conditions, cost factors, and socio economic indicators. Data Visualization: Prediction Graphs: Display forecasts using line graphs or trend lines with confidence intervals. Scenario Analysis: Include visual aids for different scenarios (e.g., “What If” models) and compare predicted outcomes. Integration: Ensure the tool is linked with real time data from the dashboard for up to date predictions. User Interactions: Provide clear instructions and tooltips to guide users through inputting data and interpreting results. General Requirements: Responsiveness: Ensure the webpage is fully responsive and optimized for both desktop and mobile devices. Aesthetics: Use a modern, professional design with consistent color schemes and fonts that align with the brand’s identity. Accessibility: Design with accessibility in mind, including keyboard navigation and screen reader support.