Dashboard Spesapp - Copy this React, Tailwind Component to your project
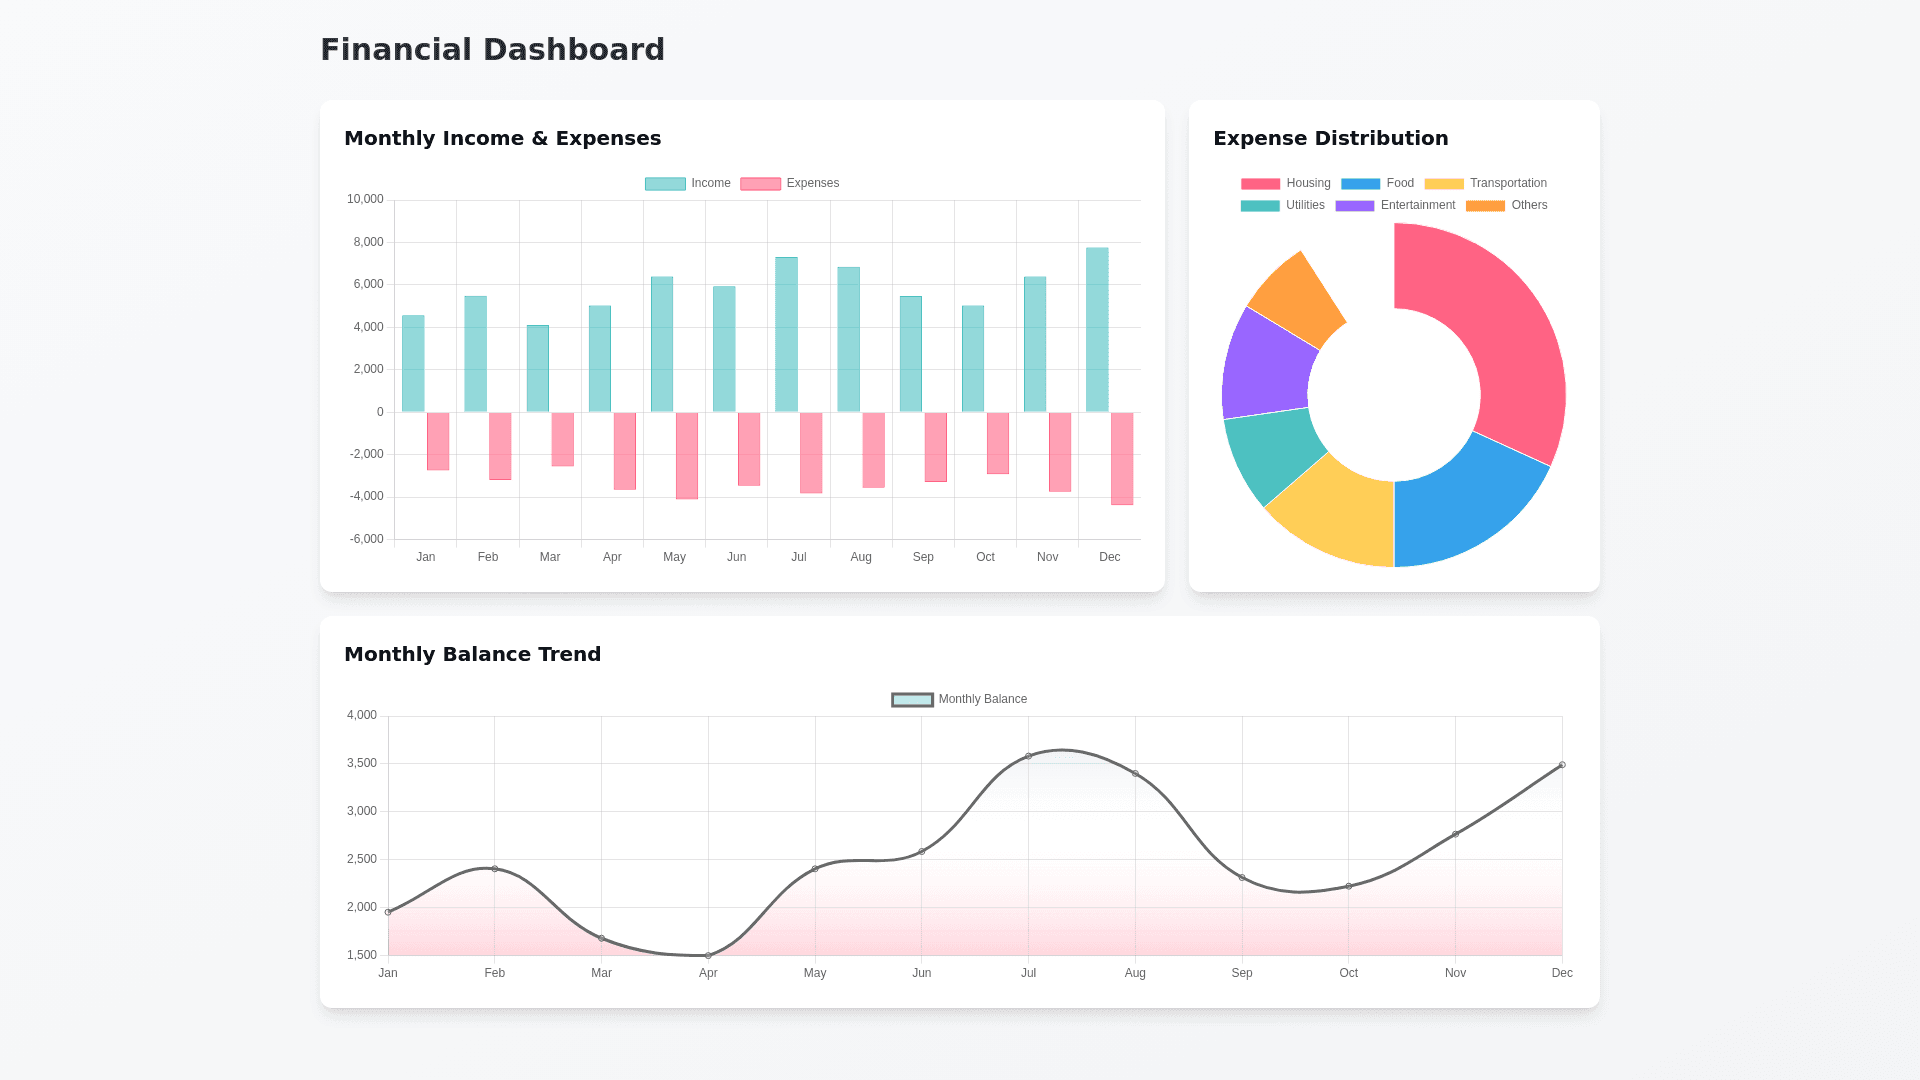
I-would-like-to-implement-a-dashboard-containing-a-bar-chart-on-the-left-(2/3-of-the-page-width)-and-a-donut-chart-on-the-right-(1/3-of-the-page).-The-data-that-make-up-both-charts-are-taken-from-a-table-containing-the-following-characteristics:-date-(data-type:-datetime),-amount-(currency),-category-(text)-and-type-(income-"r"-or-expense-"s").-The-bar-chart-must-represent-the-monthly-trend-(last-12-months)-of-expenses-and-income,-representing-stacked-columns-for-each-month-(positive-y-values-for-income,-negative-for-expenses).-The-columns-characterizing-income-should-be-colored-light-green,-while-expenses-should-be-colored-light-red.-The-donut-chart-represents-the-percentage-distribution-by-category-of-expenses-over-the-last-12-months.-In-the-row-below,-there-must-be-a-smoothed-line-chart-with-the-area-below-filled-with-the-x-axis.-The-line-represents-the-monthly-balance-between-income-and-expenses.-The-area-below-the-line-should-be-filled-using-a-gradient:-above-the-x-axis-green-and-below-light-red.-The-fill-has-an-opacity-of-0.4.