Dashboard - Copy this React, Tailwind Component to your project
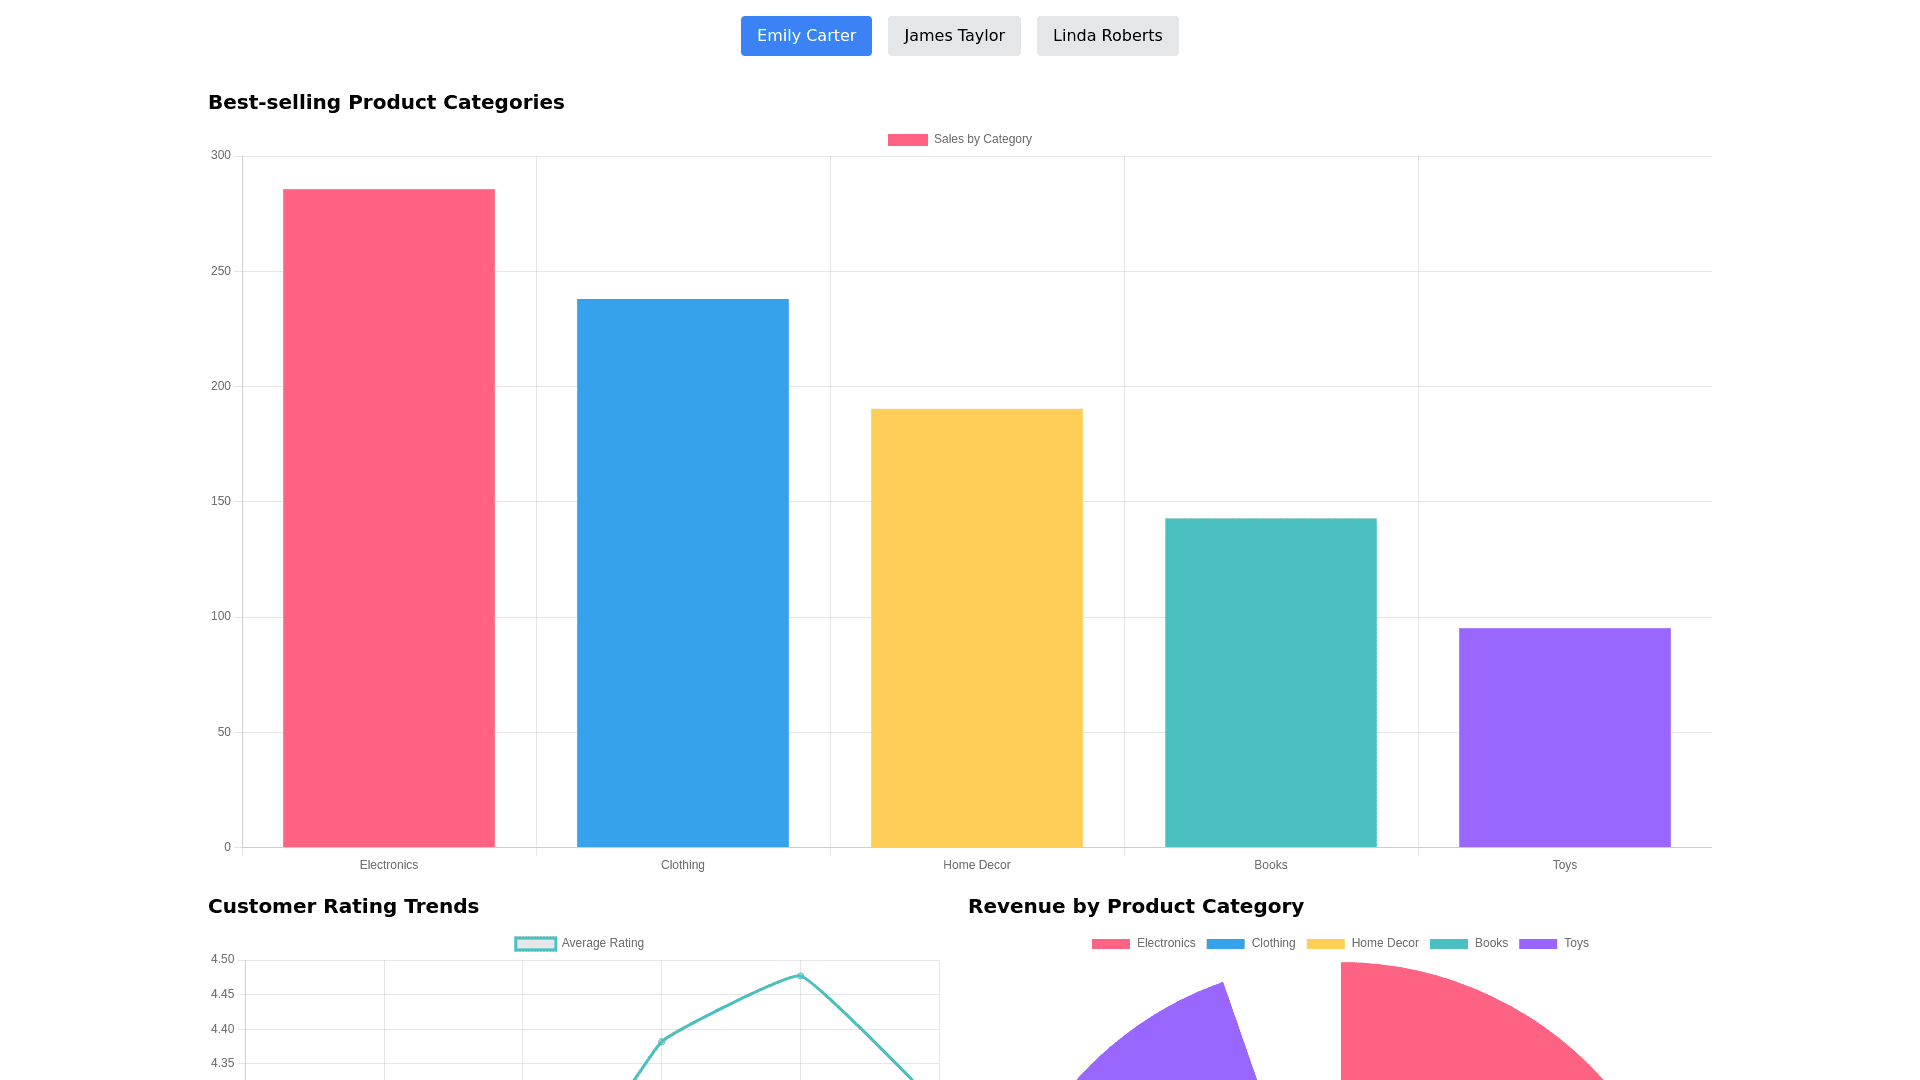
Instructions: Analyze the provided data table to understand the available information. Choose 3 out of 5 persona, identify their data needs and translate these into data stories. Design dashboards that visually present the required data and charts tailored to each persona’s needs. Submit the dashboards along with a brief explanation of your design choices and how they meet the needs of each persona. Required Charts and Data Stories: 1. Emily Carter (Head of Product Marketing) Need: Emily needs to understand the purchasing trends for different product categories, with a focus on identifying the best selling products and the regions where they perform the best. She also needs to monitor customer ratings to ensure product quality. Required Data/Charts: Best selling product categories by region, customer rating trends, revenue by product category. 2. James Taylor (Supply Chain Manager) Need: James is responsible for managing inventory and ensuring that popular products are always in stock. He needs a dashboard that shows the quantity of products sold over time, identifies trends in demand, and helps forecast future inventory needs. Required Data/Charts: Quantity sold by product category and region, demand trends over time, inventory forecast based on sales data. 3. Linda Roberts (Customer Experience Manager) Need: Linda focuses on improving the overall shopping experience for customers. She needs to track customer feedback and ratings across different product categories and regions to identify areas for improvement. Required Data/Charts: Customer ratings by product category, feedback trends by region, identification of products with low customer satisfaction. 4. Tom Miller (Financial Analyst) Need: Tom is responsible for analyzing the company’s revenue performance. He needs a dashboard that breaks down total revenue by product category, region, and customer demographics, and compares it to unit prices to understand profitability. Required Data/Charts: Revenue by product category and region, comparison of unit prices to total revenue, profitability analysis. 5. Samantha Green (Customer Segmentation Analyst) Need: Samantha’s role is to segment customers based on their purchasing behavior. She needs to analyze customer demographics, purchase patterns, and identify which segments are most profitable for the company. Required Data/Charts: Customer segmentation by age and gender, purchase patterns by segment, profitability of different customer segments.