A
Anonymous
Dashboard Filters - Copy this React, Tailwind Component to your project
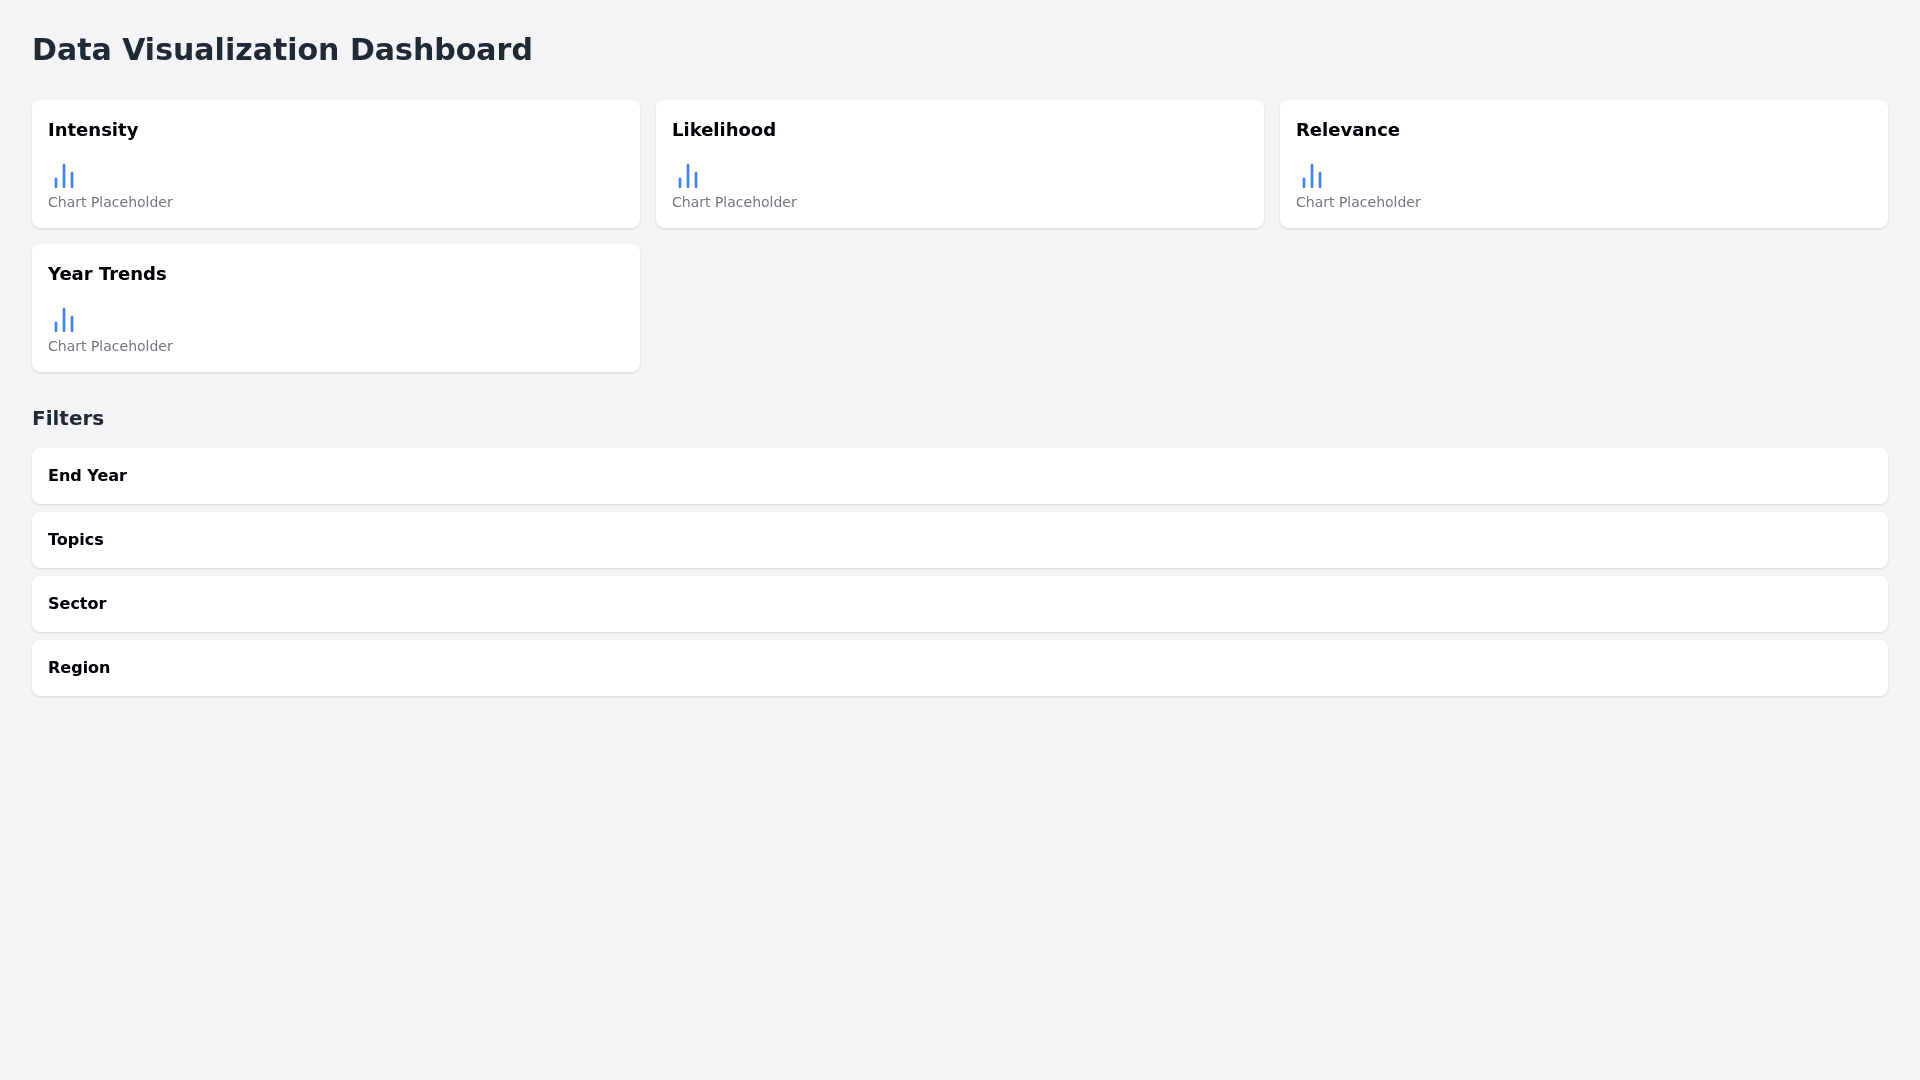
Create a Data Visualization dashboard with Important variables to be visualized Intensity, Likelihood, Relevance, Year, Country ,Topics ,Region ,City Filters in the dashboard Add end year filter in the dashboard,Add topics filters in the dashboard, Add sector filter in the dashboard, Add region filter in the dashboard, Add PEST filter in the dashboard, Add Source filter in the dashboard, Add SWOT filter in the dashboard Country & City
Prompt
