E Commerce Dashboard - Copy this React, Tailwind Component to your project
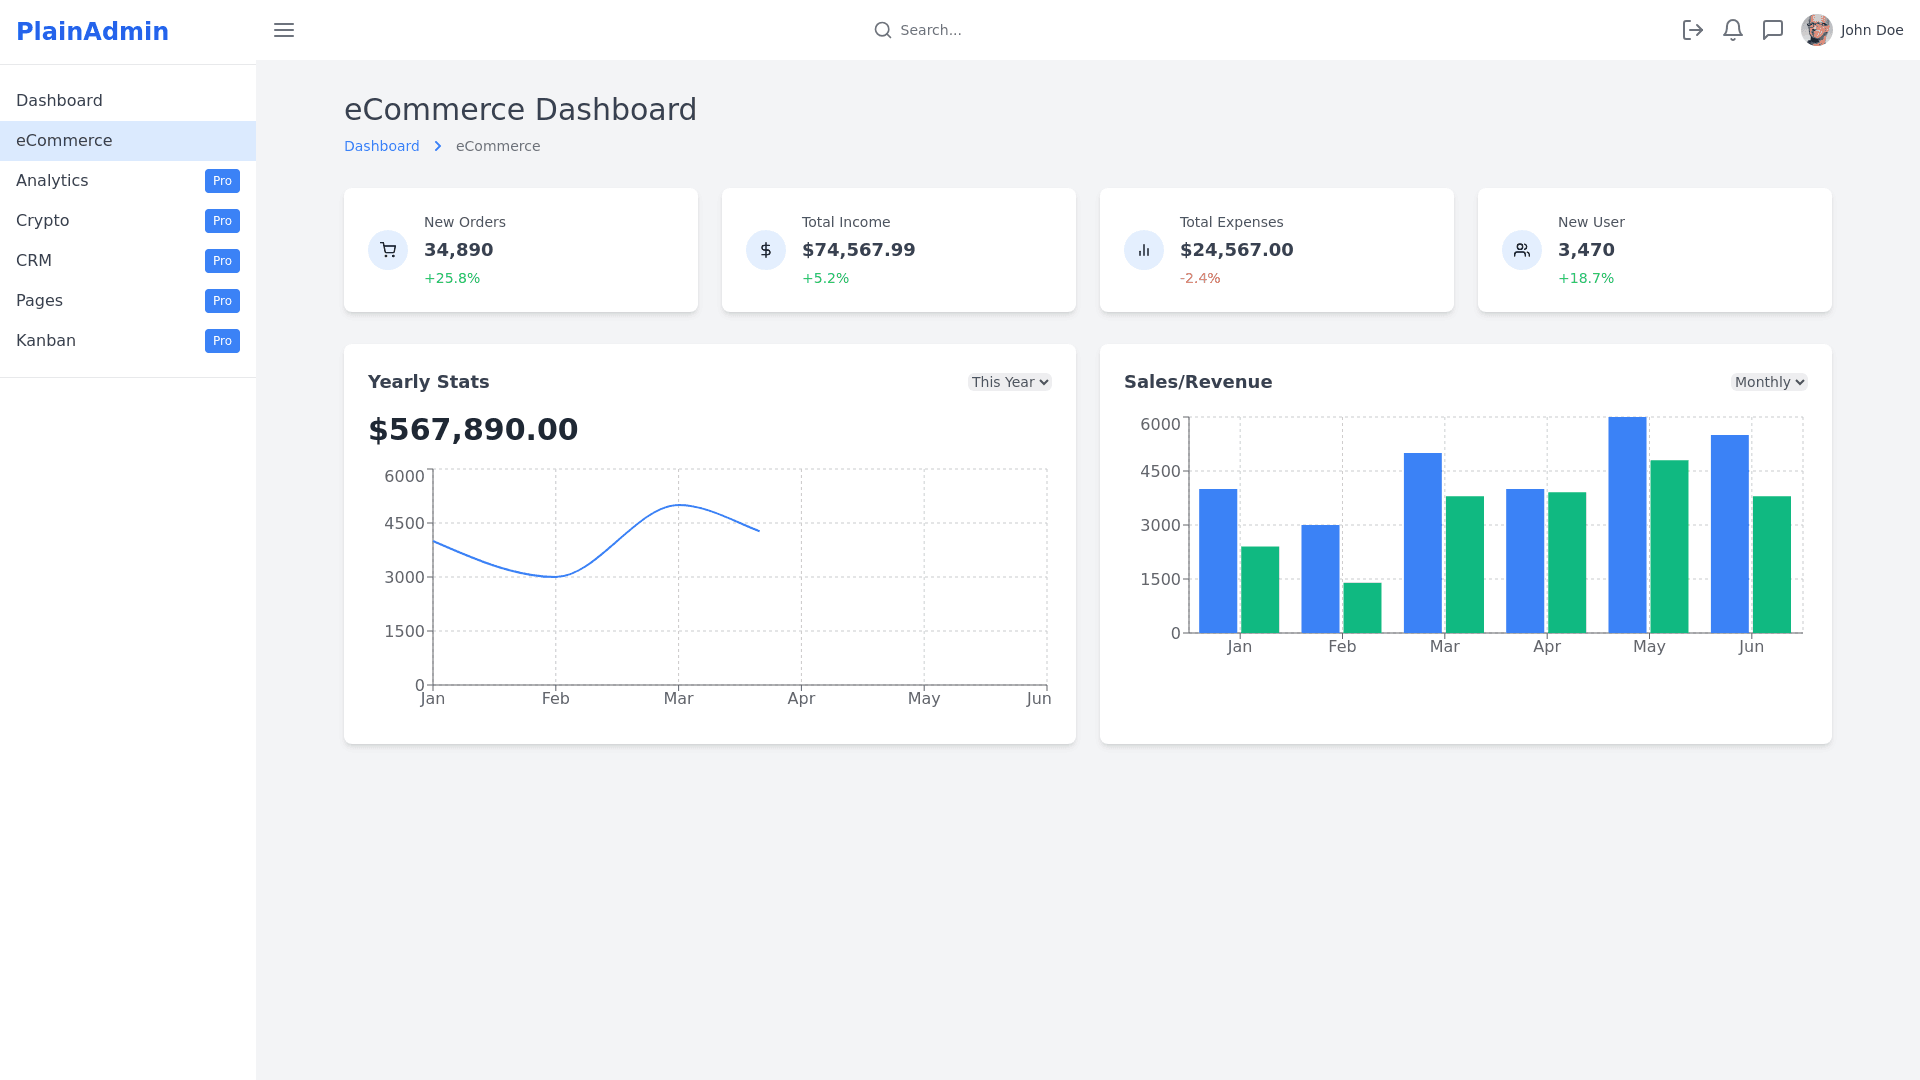
Create a sleek, modern eCommerce dashboard interface with a light color palette and a clean, user-friendly design. The layout features a sidebar on the left, a top navigation bar, and a main content area. Sidebar: The sidebar is positioned vertically on the left and includes a logo at the top that reads 'PlainAdmin', with a white background and a blue accent on the logo. Below the logo are the following menu items in a vertical list: 'Dashboard' (active, highlighted in light blue) 'eCommerce' (active and selected, also highlighted in light blue) 'Analytics', 'Crypto', 'CRM' (each marked with a blue 'Pro' tag beside the text) A separator line below these items. Additional items like 'Pages', 'Kanban', 'File Manager', 'Profile', 'Invoice', 'Task', 'Calendar', also marked with blue 'Pro' tags beside them. Top Navigation Bar: At the top center of the screen, there is a button labeled 'Menu' on the left-hand side, and next to it, a search bar with placeholder text 'Search...'. On the right-hand side, there are three small icons (a lock for privacy or logout, a bell for notifications, and a message/mail icon), followed by a circular user avatar with 'John Doe' labeled beside it. Main Dashboard Content: Title Section: At the top of the main content area, there is a title that reads 'eCommerce Dashboard', followed by a breadcrumb navigation that shows 'Dashboard / eCommerce'. Statistics Cards: Below the title, there are four statistics cards displayed horizontally: 'New Orders' with a shopping cart icon, showing '34,567' with a green '+2.00%' change label indicating growth over 30 days. 'Total Income' with a dollar icon, showing '$74,567' with a green '+5.45% Increased' label indicating growth. 'Total Expenses' with a receipt icon, showing '$24,567' with a red '-2.00% Expense' label indicating a decrease. 'New User' with a person icon, showing '34,567' with a red '-25.00% Earning' label indicating a significant drop. Charts Section: Below the stats cards, the left-hand section features a graph titled 'Yearly Stats', with a figure of '$245,479' and a line chart below it showing a rising trend. The chart includes a dropdown to select time periods (set to 'Yearly'). On the right-hand side, there is another chart titled 'Sales/Revenue', which features vertical bars representing revenue data, with a similar dropdown for filtering by time period (set to 'Yearly'). The overall design has a soft, minimalistic look, using light pastel colors like light blue, soft green, and white. The edges of the elements are slightly rounded, and there are subtle shadows behind the cards and charts for a modern, professional feel.