Emissions Data Explorer - Copy this Html, Bootstrap Component to your project
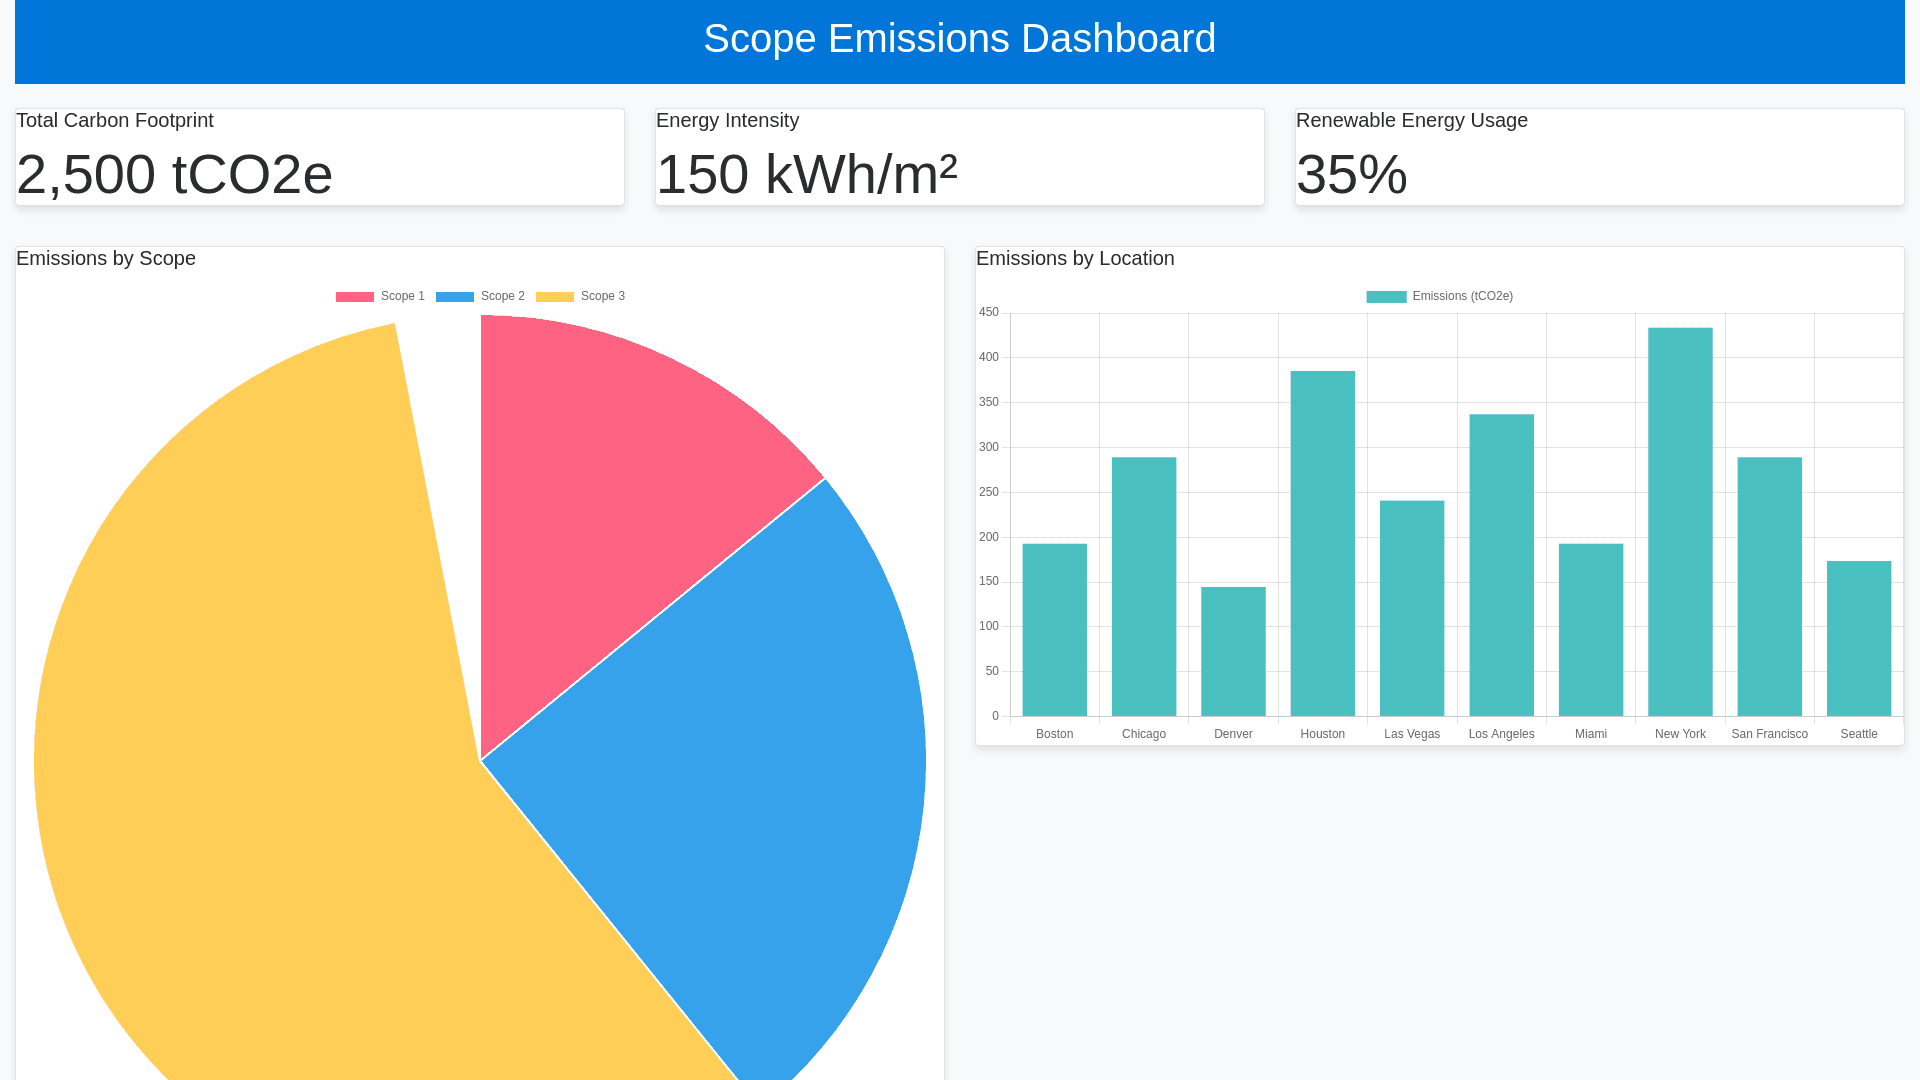
Could you help me to immagine a web app that goes in drill down on each of the 3 scope emissions values of 10 building localised in: Boston, Chicago, Denver, Houston, Las Vegas, Los Angeles, Miami, New York, San Francisco, Seattle. The emissions considered In Scope1 are Diesel, biodisel, gas consumption for heating combustion and vehicles usage, fugitive emissions (air conditioning, purchases and release of industrial gases) Scope 2 for Facilities =Non green electricity consumption. Scope 3 for Facilities=Purchases of office fitting, building repairs and maintenance Energy extraction, production and transport upstream and downstream Waste treatement. It has to have graphical information, and maximum 3 label with the most important summarizing KPI. It has also to give the opportunity to see the scope 1,2 and 3 details for each location site.