SP4
Surya Peddireddy 420
Styled Card - Copy this React, Mui Component to your project
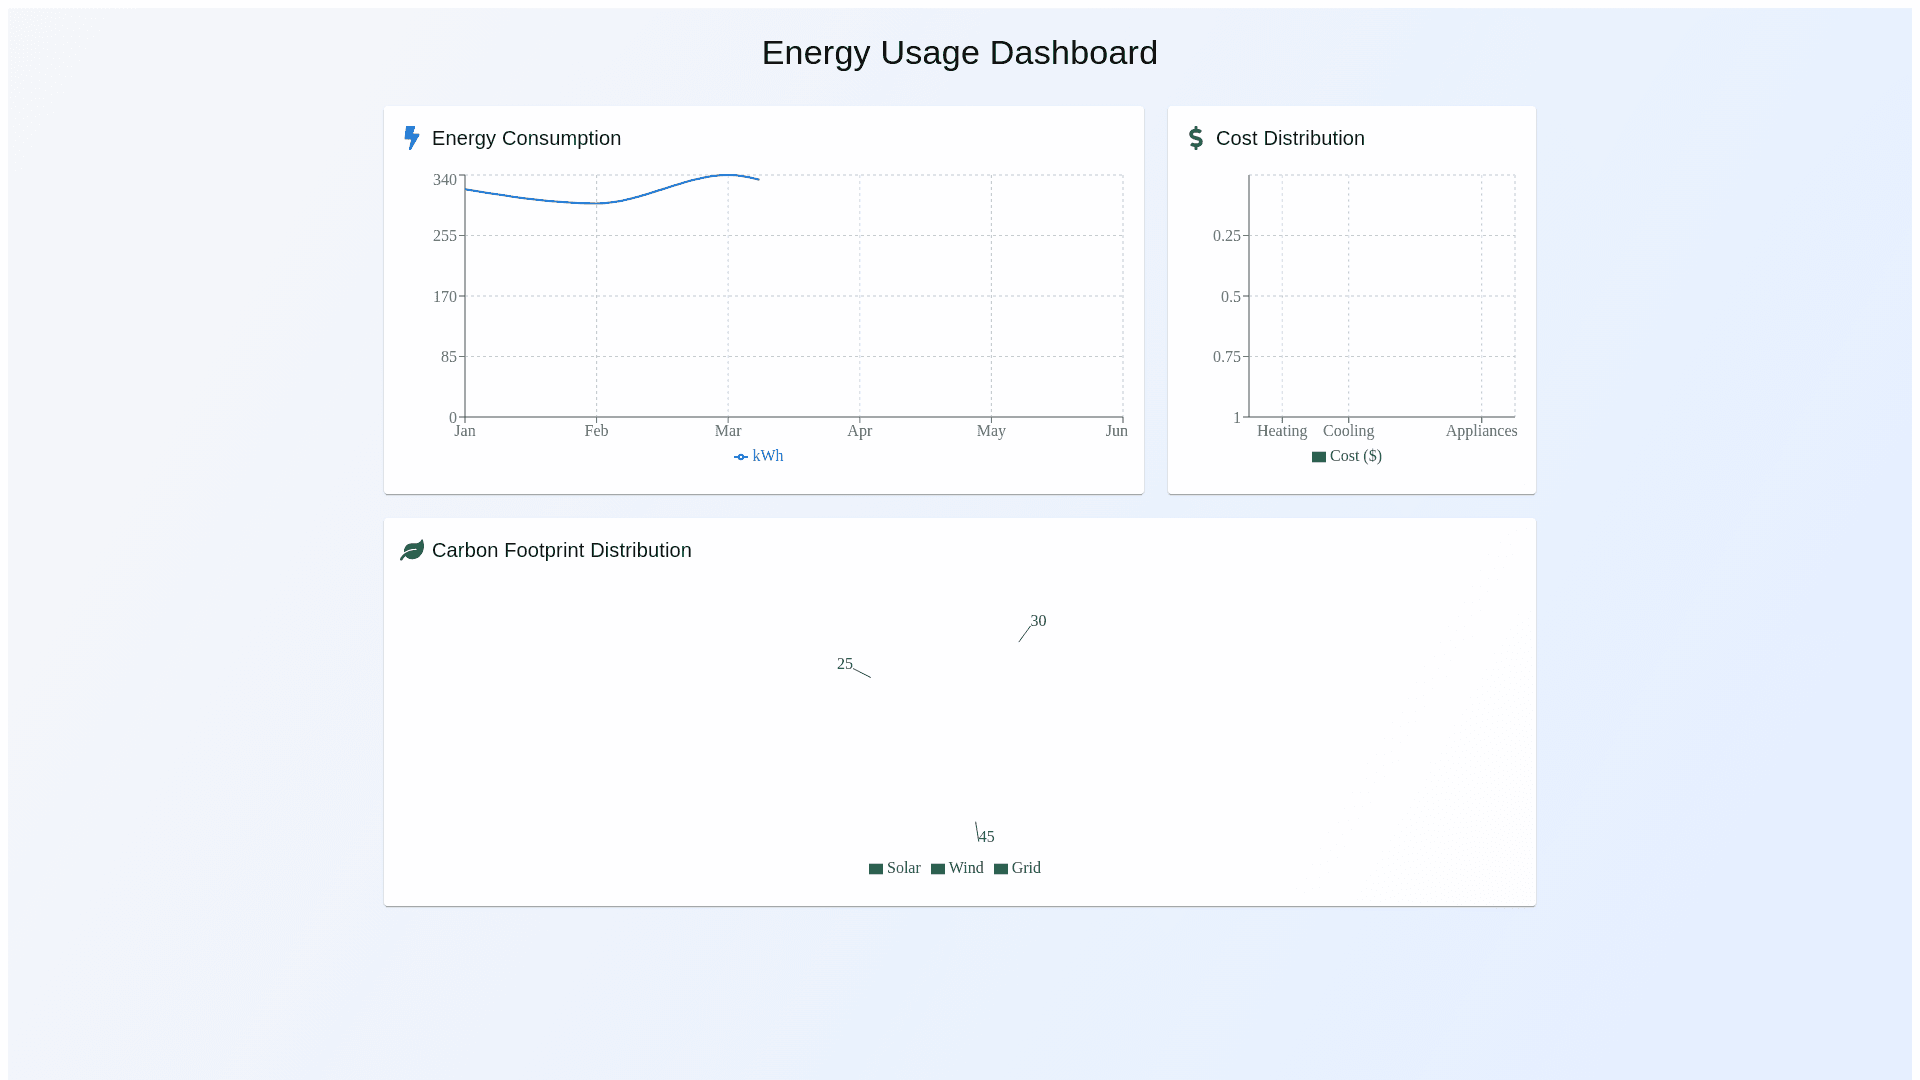
Create a responsive dashboard to visualize energy usage data, featuring key metrics such as energy consumption in kWh, cost trends in dollars, carbon footprint in tons of CO2 emissions, and energy efficiency improvements over time. The layout should be clean and intuitive, with interactive elements to explore the data in detail. Include visualizations like line graphs for cost trends and energy efficiency, bar charts for carbon footprint comparisons, and dynamic indicators for real time energy usage. Ensure the design is optimized for both desktop and mobile views, providing a seamless user experience.
Prompt