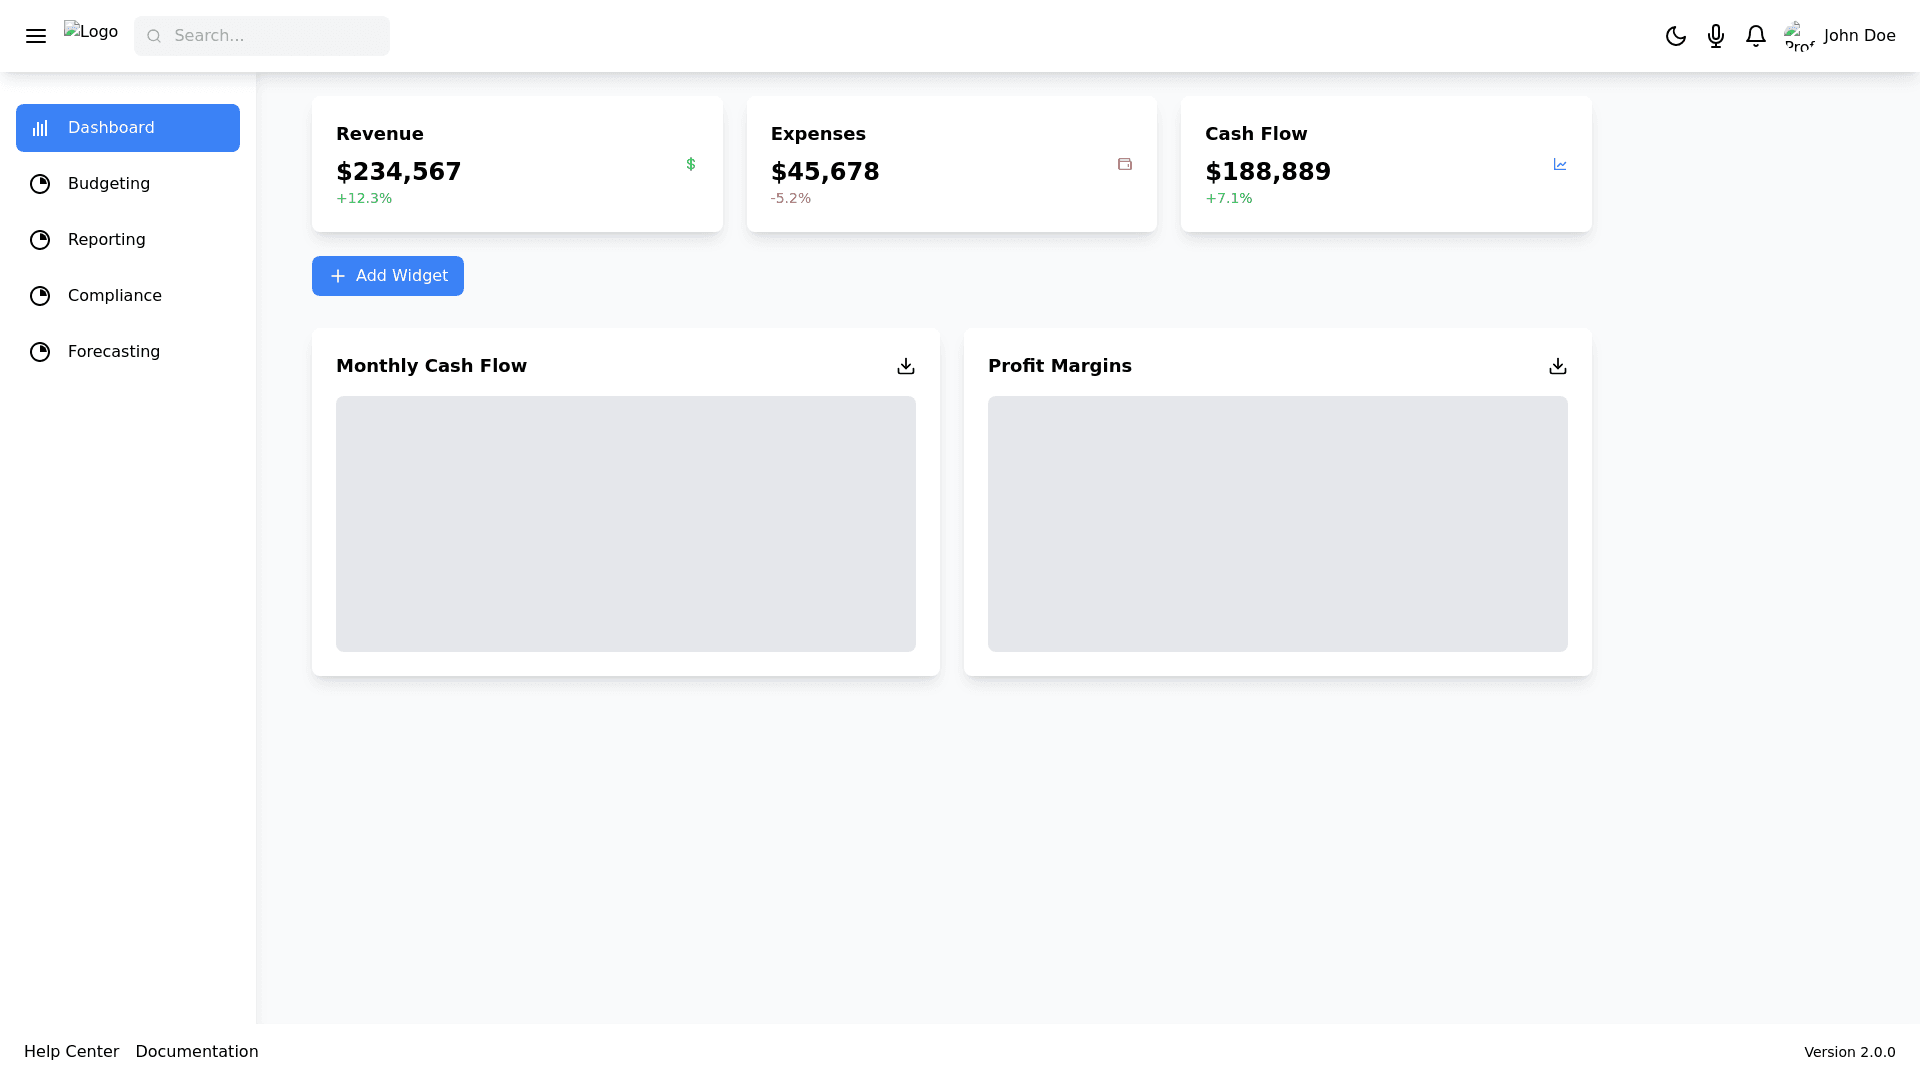
Dashboard - Copy this React, Tailwind Component to your project
FinAnalystPro-Dashboard-UI-Design-Concept-Design-Principles-Simplicity:-Clean,-modern,-and-intuitive-interface-to-reduce-cognitive-load.-Data-Centric:-Focus-on-presenting-key-metrics-prominently.-Personalization:-Allow-users-to-tailor-the-dashboard-to-their-needs.-Responsiveness:-Optimized-for-desktop,-tablet,-and-mobile-platforms.-UI-Components-Header-Bar:-Logo:-Positioned-on-the-top-left.-Global-Search-Bar:-Quick-access-to-financial-reports,-KPIs,-and-tools.-Profile-Dropdown:-For-account-settings,-logout,-and-theme-selection.-Notification-Bell:-Displays-alerts-and-notifications.-Sidebar-Navigation:-Modules:-Links-to-Budgeting,-Reporting,-Compliance,-Forecasting,-and-more.-Collapsible-Design:-Saves-screen-space-on-smaller-devices.-Active-State-Indicator:-Highlights-the-active-module-(Dashboard).-Main-Dashboard-Area:-KPI-Widgets:-Default-layout-with-revenue,-expenses,-and-cash-flow-widgets.-Drag-and-drop-customization-enabled.-Customizable-Layout:-Add-Widget-Button:-Opens-a-library-of-pre-built-and-custom-KPIs.-Resize-and-rearrange-widgets-using-a-grid-system.-Insights-Panel:-Trends-and-Analysis:-Graphs-for-monthly-cash-flow-trends,-profit-margin-breakdowns,-etc.-Interactive-Charts:-Hover-for-details.-Click-to-drill-down-into-detailed-reports.-Alerts-and-Notifications-Panel:-Positioned-on-the-right-or-as-a-dropdown-from-the-header.-Color-Coded-Alerts:-Red:-Critical-issues-(e.g.,-overdue-payments).-Yellow:-Warnings-(e.g.,-budget-nearing-limit).-Green:-Opportunities-(e.g.,-surplus-cash-available-for-investment).-Footer:-Support-and-Documentation-Links:-Access-to-help-center-and-guides.-Version-Info:-Display-current-platform-version.-UI-Color-Scheme-Primary-Colors:-Blue-and-white-(for-a-professional-and-clean-look).-Accent-Colors:-Green:-Positive-metrics-(e.g.,-profit-growth).-Red:-Negative-metrics-(e.g.,-revenue-decline).-Yellow:-Alerts-or-warnings.-Dark-Mode-Support:-Optional-theme-for-users-who-prefer-reduced-eye-strain.-Dashboard-Layout-Mockup-Top-Section:-Financial-Health-Score:-Prominent-and-visually-represented-as-a-gauge.-Quick-Metrics:-Three-cards-showing-revenue,-expenses,-and-profit/loss.-Middle-Section:-Main-Widgets:-Cash-Flow-Summary-(line-chart).-Revenue-vs.-Expenses-(bar-graph).-Debt-to-Income-Ratio-(doughnut-chart).-Custom-KPI-Slots:-Two-empty-slots-for-user-defined-widgets.-Bottom-Section:-Recent-Transactions:-Scrollable-table-of-recent-entries.-Upcoming-Deadlines:-List-with-due-dates-for-tax-filings,-loan-repayments,-etc.-Advanced-Features-Voice-Interaction:-A-microphone-icon-in-the-header-enables-voice-commands.-Export-Data-Button:-Positioned-near-the-widgets-for-quick-downloads-(PDF/Excel).-Storytelling-Mode:-Toggle-switch-to-present-widgets-in-full-screen-mode-for-meetings.