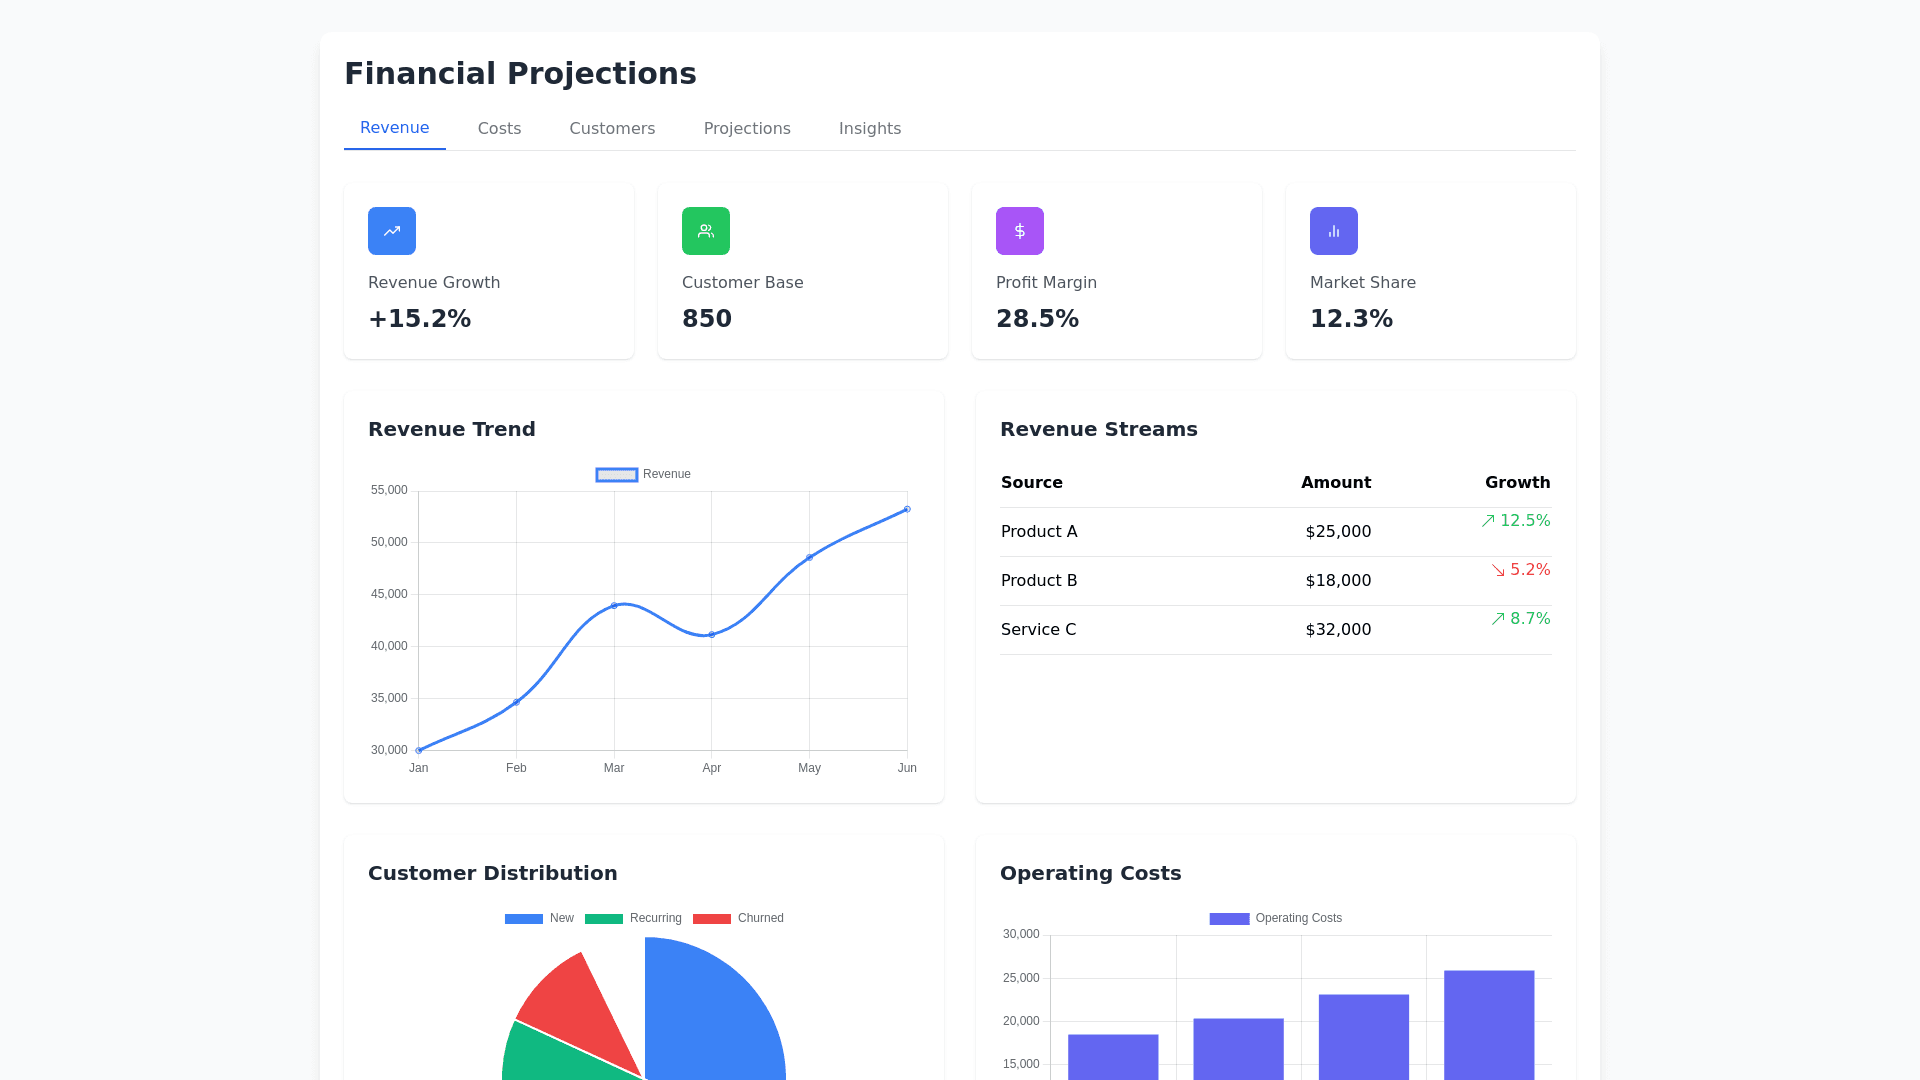
Financial Projection - Copy this React, Tailwind Component to your project
Here’s a **UI Design Plan** for the **Financial Projection Sheet for FinAnalystPro**, focusing on presenting the information interactively and effectively for users in India: ### **1. Design Overview** The UI will include: **Tabular Layouts**: For structured data like revenue streams, costs, and projections. **Interactive Charts**: For data visualization (bar graphs, line charts, etc.). **Filter Options**: Monthly, quarterly, and yearly breakdowns. **Summary Cards**: Highlighting key metrics (CAC, LTV, Churn Rate, Total Revenue). **Responsive Design**: Ensures compatibility across desktops, tablets, and mobile devices. ### **2. Page Sections** #### **a. Header** **Title**: "FinAnalystPro Financial Projections" **Subheading**: "A comprehensive projection for Year 1 3" **Navigation**: Tabs for Revenue, Costs, Metrics, Projections, and Insights. #### **b. Revenue Streams Section** **Table**: Display subscription plans, add ons, and training revenues. **Interactive Feature**: Dropdowns to view details for each revenue stream. Editable fields for users to input custom values (₹X, ₹Y). **Graph**: A stacked bar chart showing the proportion of revenue streams. #### **c. Cost Structure Section** **Fixed Costs**: Table with categories like Salaries, Office Rent, Software Licenses. Total Fixed Costs displayed prominently. **Variable Costs**: Table for Marketing, CAC, and Server Expenses. Total Variable Costs displayed. **Graph**: Pie chart showing the proportion of fixed vs. variable costs. #### **d. Customer Metrics Section** **Metrics Table**: CAC: Formula based calculation. LTV: Auto calculated based on average revenue per user. Churn Rate: Dynamic value showing monthly/annual churn. **Graph**: Line graph tracking CAC vs. LTV over time. #### **e. Projections Section** **Revenue & Expense Breakdown**: Dynamic table with monthly and quarterly breakdown. Columns: Total Revenue, Total Expenses, Profit/Loss. Editable cells for future projections. **Cash Flow Statement**: Interactive table with opening balance, total revenue, total expenses, and closing balance. Option to download/export as Excel. **Graph**: Area chart for cash flow trends. #### **f. Insights Section** **Summary Cards**: Highlight profitability milestones. Show projected growth in recurring revenue. Key recommendations for cost saving measures. **Interactive Tips**: Hover over icons providing explanations of metrics. **Graphs**: Line chart for Churn Rate over time. Combined bar and line chart for Revenue vs. Expenses. ### **3. Design Tools and Framework** **Frontend Framework**: React.js (for interactivity). **Styling**: Tailwind CSS or Material UI for modern design. **Charting Library**: Chart.js or ApexCharts for data visualization. **State Management**: Redux (if needed for complex data handling). **Responsive Design**: Media queries and CSS grid for adaptability. ### **4. User Interaction Features** **Dynamic Inputs**: Users can update revenue, costs, and projections. **Save/Export Options**: Export the financial projection as Excel/PDF. **Visualization Toggle**: Switch between chart types (e.g., bar, line). **Tooltips**: Explain formulas and metrics in simple terms.