Styled Table Cell - Copy this React, Mui Component to your project
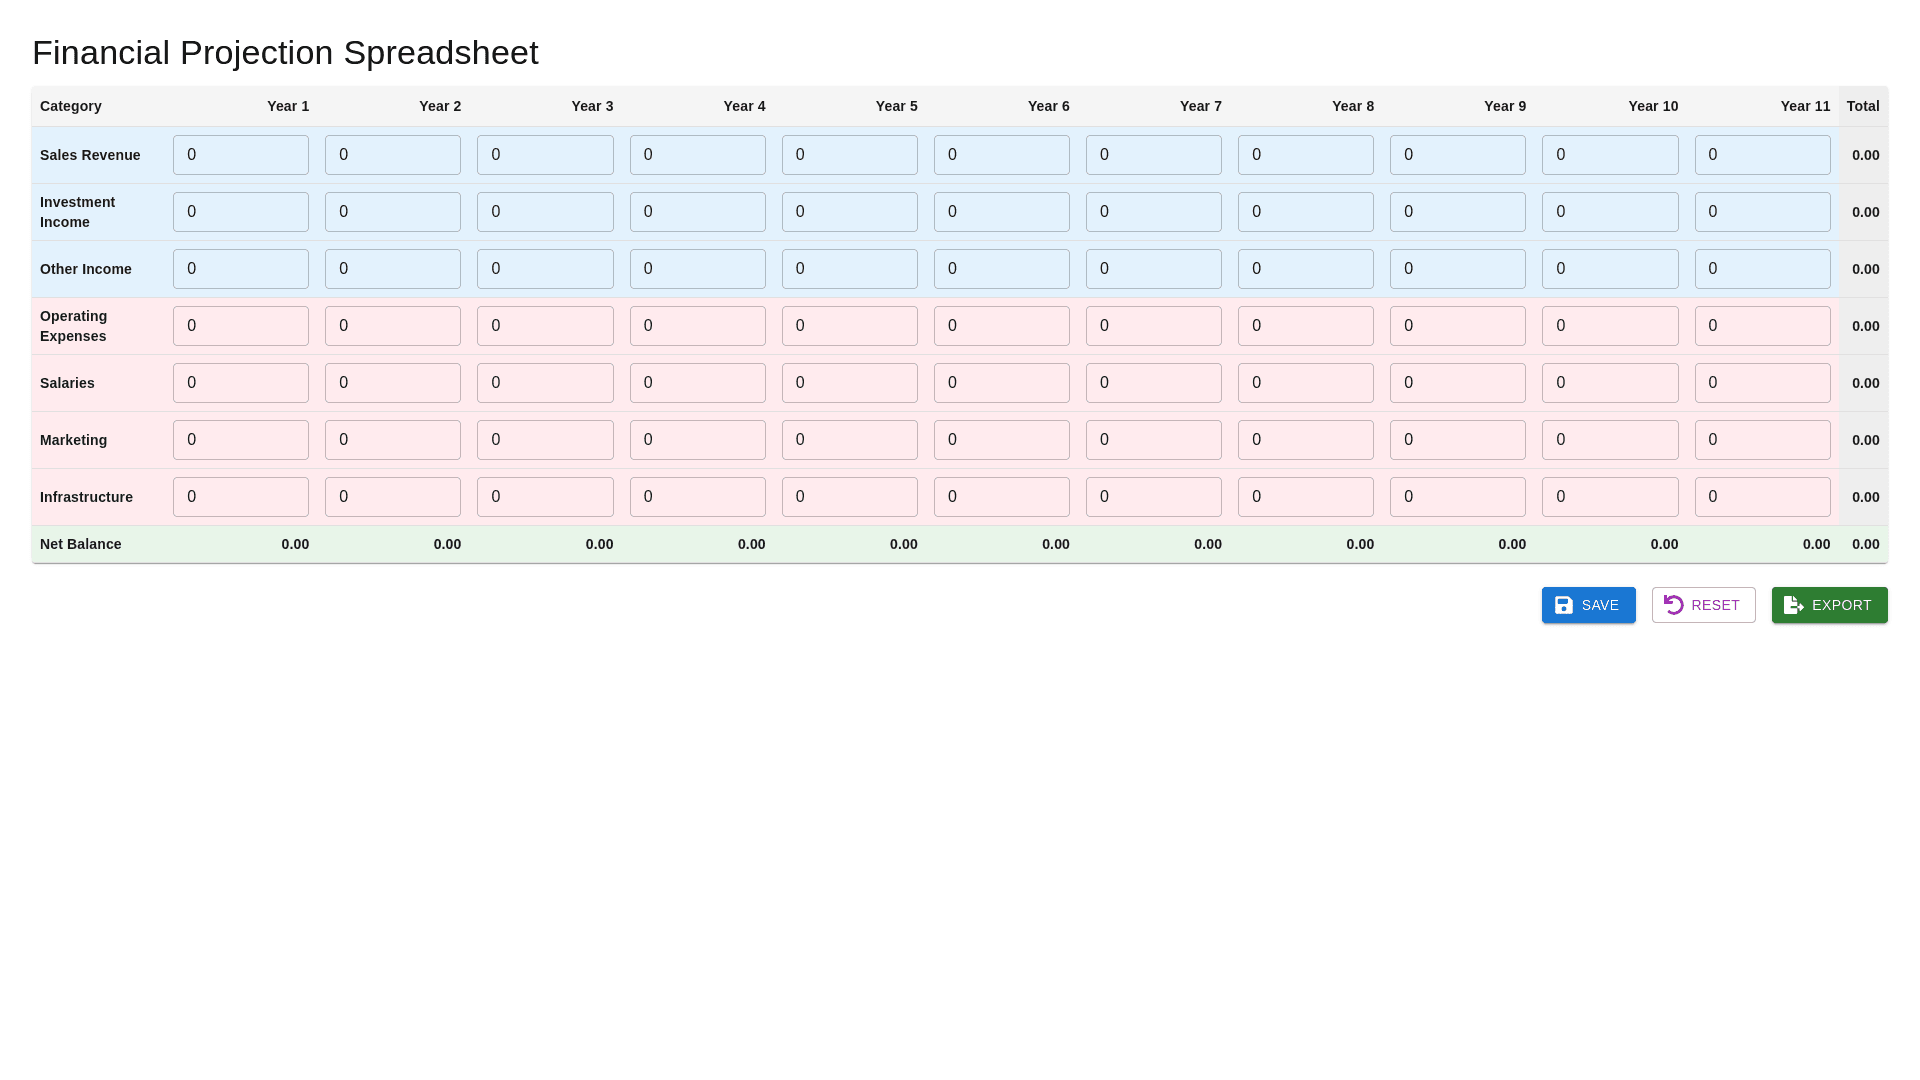
Objective: Create a web interface for a financial projection spreadsheet over 11 years, allowing users to input and view data for income and expenses, and automatically calculate totals for each category, as well as the net balance of the financial projection. Interface Requirements: Spreadsheet Structure: Rows: Header Row: Column 1: Categories (e.g., Income, Expenses, etc.) Columns 2 12: The projection years (Year 1 to Year 11). Column 13: Total (which calculates the sum of each row of income and expenses). Column 14: Net Balance (calculated as the difference between the total income and total expenses). Data Rows: Each row corresponds to a category of income or expense. The cells under the year columns (2 12) should be editable, allowing users to input financial data. Total Cells: At the end of each income and expense column (column 13), show the calculated total for each row. In column 14, calculate the net balance (the difference between the total income and total expenses). Functionality: Interactive Cells: The year cells (columns 2 12) should be editable so that users can input financial values. The total cells (columns 13 and 14) should automatically update when new data is entered in the year cells. Automatic Calculations: The totals for each category (income, expenses) should update in real time. The net balance should automatically update whenever income or expense values are modified. Visual Design and Styling: Minimalist and Clean Style: The interface should be intuitive and simple, with a white or light gray background and soft lines to define the cells of the table. Colors: Use a professional color palette: shades of blue for income and shades of red or green for expenses. Totals and net balance should stand out with a subtle color (e.g., a darker blue or neutral color that contrasts but isn’t overwhelming). Legible Fonts: Cells should use a simple, readable font like "Arial" or "Roboto," with a font size large enough for comfortable reading of the data. Borders and Spacing: Use subtle borders for the cells, with enough spacing between them to keep the interface looking organized and not cluttered. Interactivity: Buttons and Actions: A "Save" button at the bottom of the page to save the entered data. A "Reset" button to clear all data and start a new projection. Export Function: Allow users to export the spreadsheet as an Excel (.xlsx) or CSV file so they can download the results and work with them offline. Hover and Selection: Cells should highlight when hovered over to indicate they are editable. Total rows should be non editable to prevent users from trying to modify them. Accessibility: Ensure the interface is accessible to people with visual and motor disabilities. Provide adequate color contrast and allow keyboard navigation between cells. Responsive Design: The interface should be fully responsive, adjusting appropriately to different screen sizes (desktop, tablet, mobile), ensuring that the cells and buttons remain accessible and easy to use on any device. Visual Summary: The page will feature a table with rows for different income and expense categories, where each cell is editable for entering values by year. Totals and net balance will be calculated automatically. Additionally, there will be action buttons to save, reset, and export data. The interface will have a clean, accessible, and professional design.