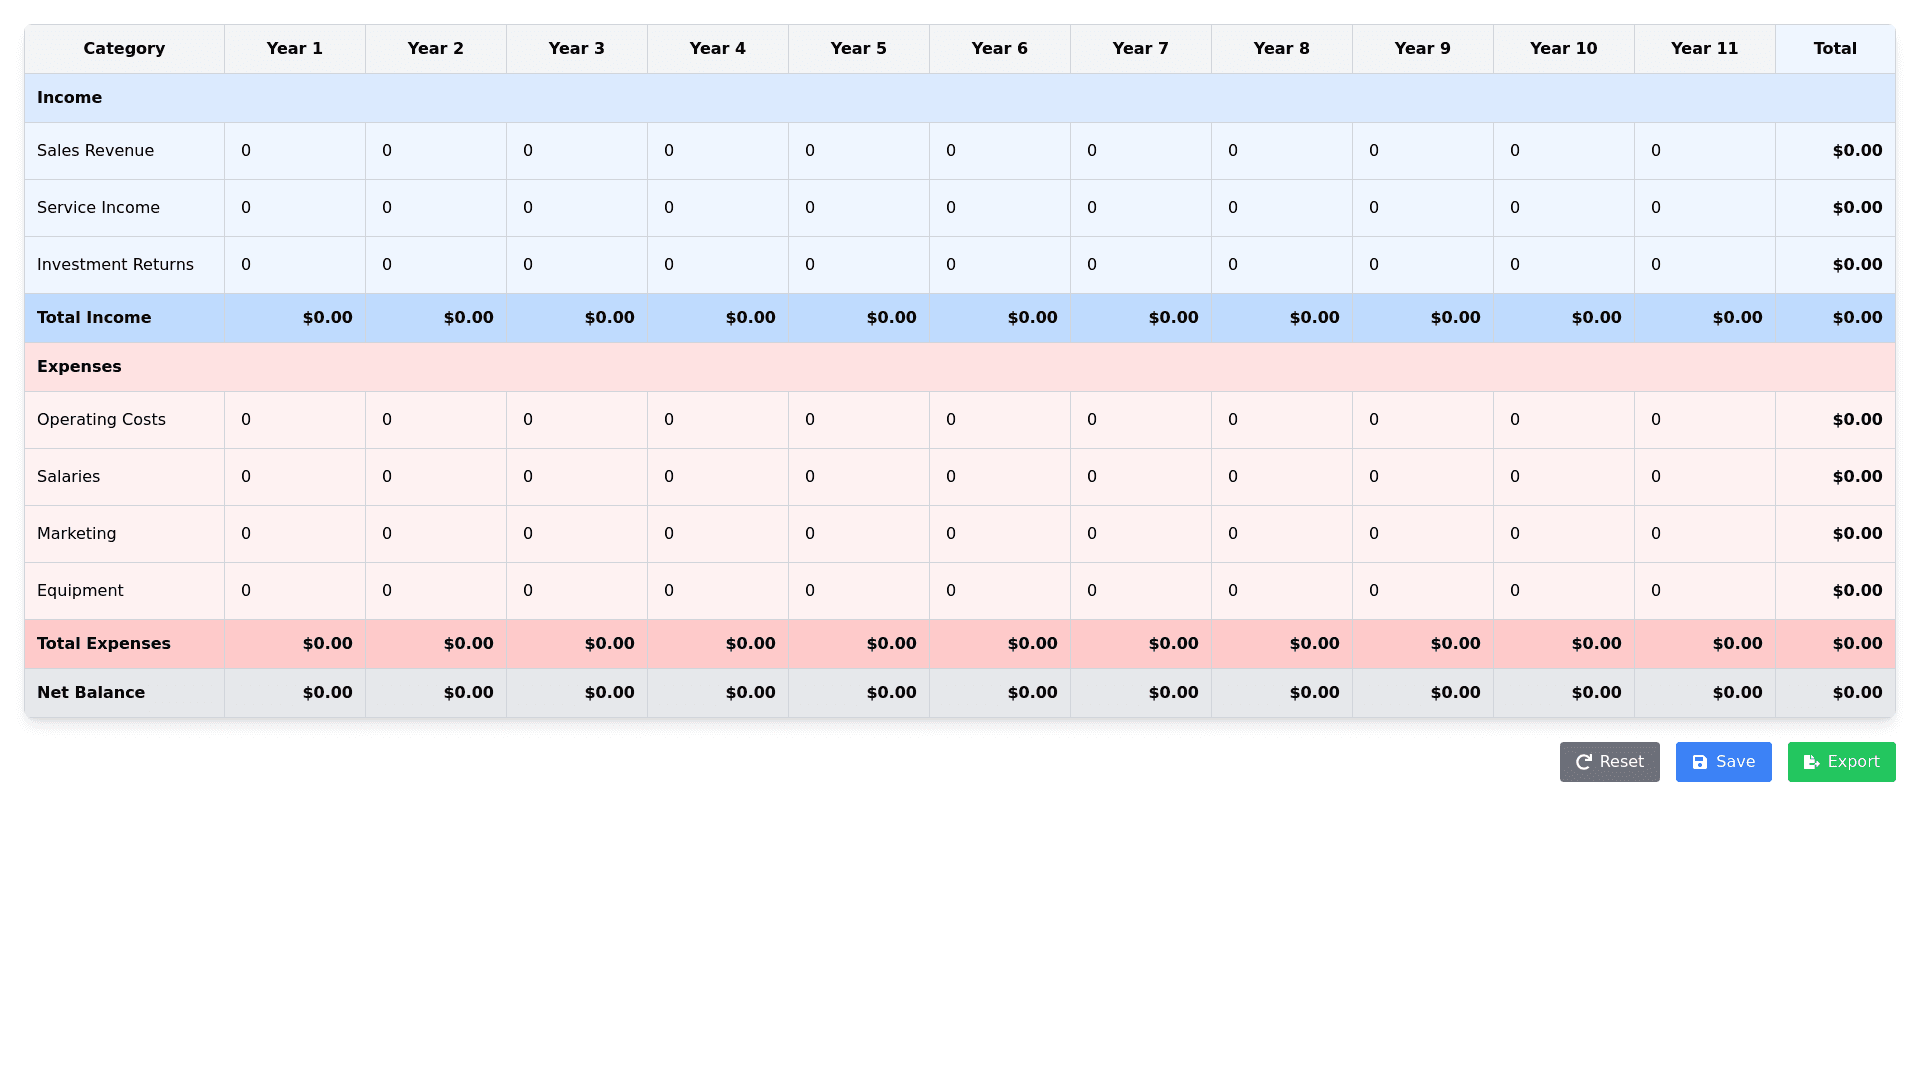
Financial Projection - Copy this React, Tailwind Component to your project
Objective:-Create-a-web-interface-for-a-financial-projection-spreadsheet-over-11-years,-allowing-users-to-input-and-view-data-for-income-and-expenses,-and-automatically-calculate-totals-for-each-category,-as-well-as-the-net-balance-of-the-financial-projection.-Interface-Requirements:-Spreadsheet-Structure:-Rows:-Header-Row:-Column-1:-Categories-(e.g.,-Income,-Expenses,-etc.)-Columns-2-12:-The-projection-years-(Year-1-to-Year-11).-Column-13:-Total-(which-calculates-the-sum-of-each-row-of-income-and-expenses).-Column-14:-Net-Balance-(calculated-as-the-difference-between-the-total-income-and-total-expenses).-Data-Rows:-Each-row-corresponds-to-a-category-of-income-or-expense.-The-cells-under-the-year-columns-(2-12)-should-be-editable,-allowing-users-to-input-financial-data.-Total-Cells:-At-the-end-of-each-income-and-expense-column-(column-13),-show-the-calculated-total-for-each-row.-In-column-14,-calculate-the-net-balance-(the-difference-between-the-total-income-and-total-expenses).-Functionality:-Interactive-Cells:-The-year-cells-(columns-2-12)-should-be-editable-so-that-users-can-input-financial-values.-The-total-cells-(columns-13-and-14)-should-automatically-update-when-new-data-is-entered-in-the-year-cells.-Automatic-Calculations:-The-totals-for-each-category-(income,-expenses)-should-update-in-real-time.-The-net-balance-should-automatically-update-whenever-income-or-expense-values-are-modified.-Visual-Design-and-Styling:-Minimalist-and-Clean-Style:-The-interface-should-be-intuitive-and-simple,-with-a-white-or-light-gray-background-and-soft-lines-to-define-the-cells-of-the-table.-Colors:-Use-a-professional-color-palette:-shades-of-blue-for-income-and-shades-of-red-or-green-for-expenses.-Totals-and-net-balance-should-stand-out-with-a-subtle-color-(e.g.,-a-darker-blue-or-neutral-color-that-contrasts-but-isn’t-overwhelming).-Legible-Fonts:-Cells-should-use-a-simple,-readable-font-like-"Arial"-or-"Roboto,"-with-a-font-size-large-enough-for-comfortable-reading-of-the-data.-Borders-and-Spacing:-Use-subtle-borders-for-the-cells,-with-enough-spacing-between-them-to-keep-the-interface-looking-organized-and-not-cluttered.-Interactivity:-Buttons-and-Actions:-A-"Save"-button-at-the-bottom-of-the-page-to-save-the-entered-data.-A-"Reset"-button-to-clear-all-data-and-start-a-new-projection.-Export-Function:-Allow-users-to-export-the-spreadsheet-as-an-Excel-(.xlsx)-or-CSV-file-so-they-can-download-the-results-and-work-with-them-offline.-Hover-and-Selection:-Cells-should-highlight-when-hovered-over-to-indicate-they-are-editable.-Total-rows-should-be-non-editable-to-prevent-users-from-trying-to-modify-them.-Accessibility:-Ensure-the-interface-is-accessible-to-people-with-visual-and-motor-disabilities.-Provide-adequate-color-contrast-and-allow-keyboard-navigation-between-cells.-Responsive-Design:-The-interface-should-be-fully-responsive,-adjusting-appropriately-to-different-screen-sizes-(desktop,-tablet,-mobile),-ensuring-that-the-cells-and-buttons-remain-accessible-and-easy-to-use-on-any-device.-Visual-Summary:-The-page-will-feature-a-table-with-rows-for-different-income-and-expense-categories,-where-each-cell-is-editable-for-entering-values-by-year.-Totals-and-net-balance-will-be-calculated-automatically.-Additionally,-there-will-be-action-buttons-to-save,-reset,-and-export-data.-The-interface-will-have-a-clean,-accessible,-and-professional-design.