Gantt Chart Component - Copy this Html, Bootstrap Component to your project
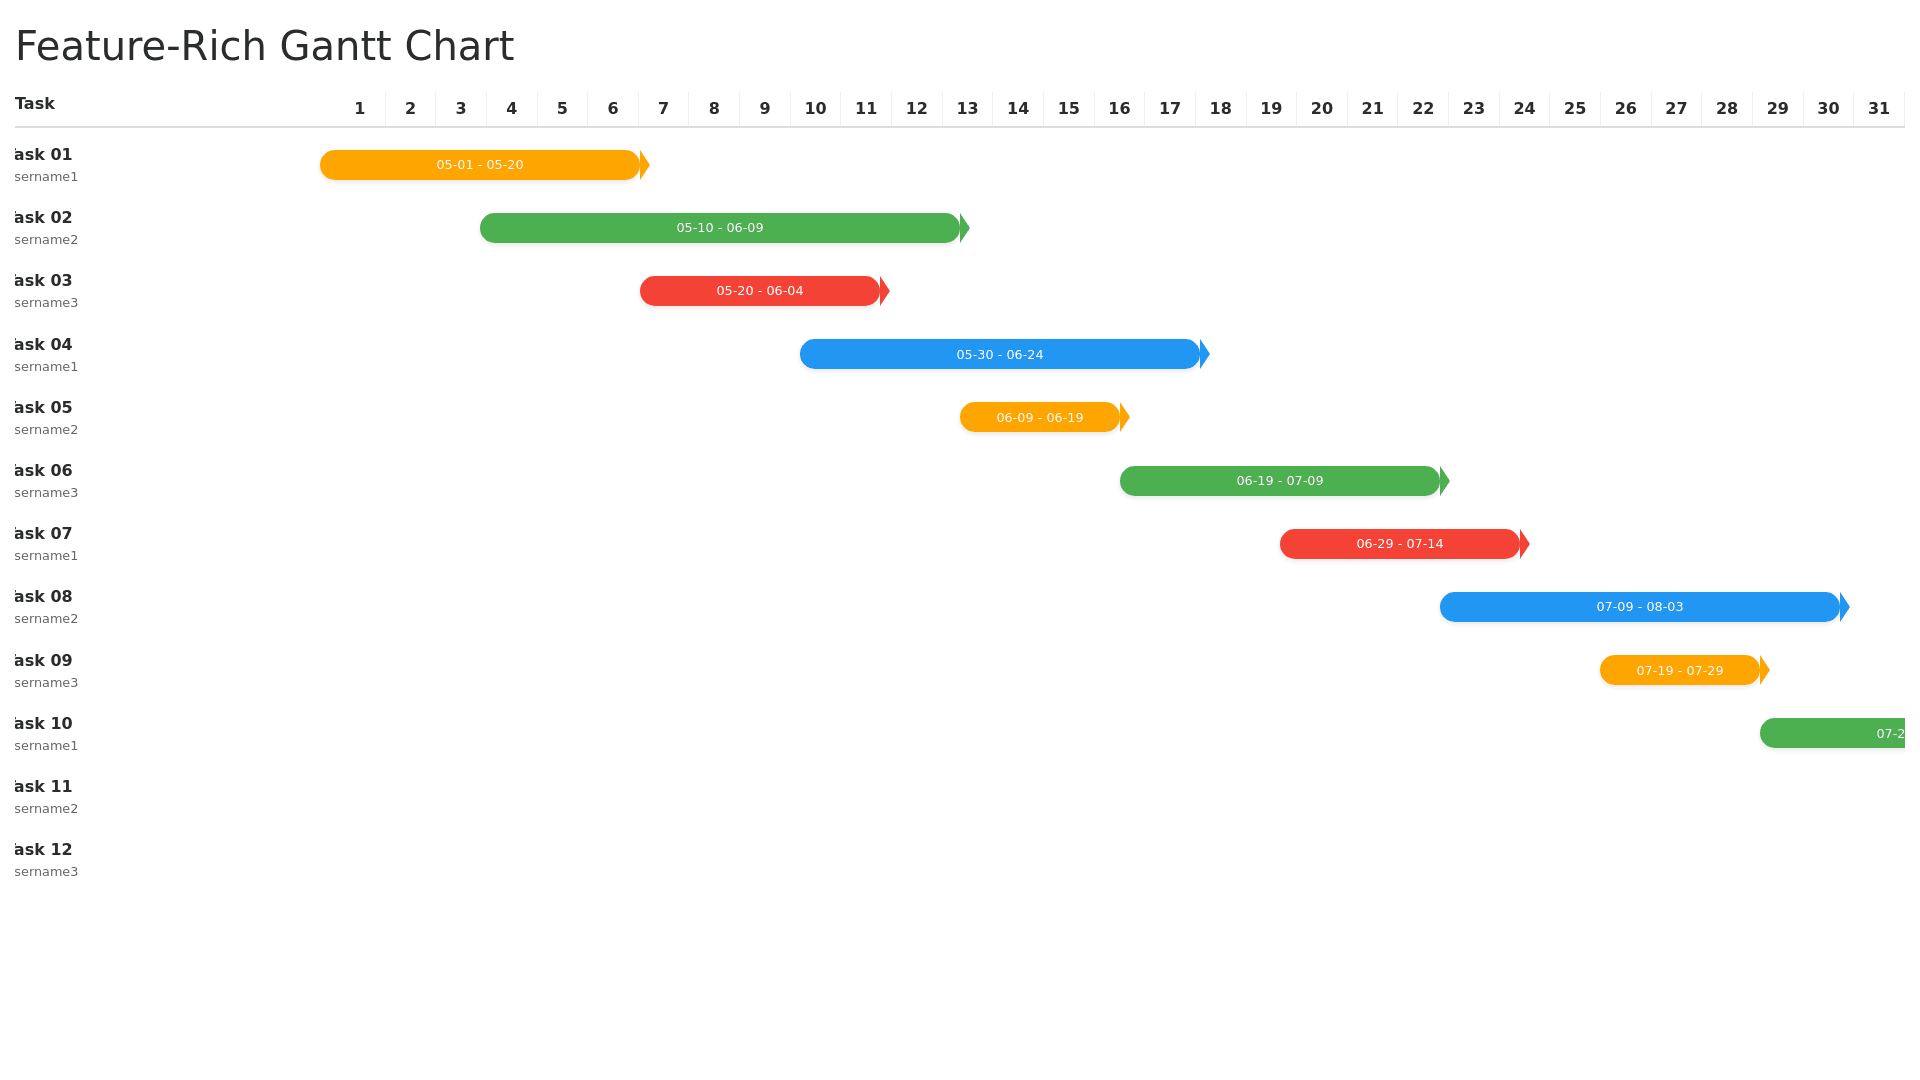
Create grantt chart with The chart is laid out with tasks listed vertically on the left hand side, from Task 01 to Task 12. Horizontal bars indicate the timeline for each task, spanning across the days of the month (numbered 1 to 31) on the top. Each task is represented by a bar with different colors, representing its duration. The bar shows the task start and end dates. Task Details: Next to each task, there's a username associated with that task (e.g., Username1, Username2, Username3). Some tasks have specific time ranges listed inside the bars, showing the start and end dates in the format MM DD. Color Usage: Different tasks have different colors (orange, green, red, blue) to visually differentiate them. Each task has an arrow at the end, indicating the direction or completion status. This Gantt chart visually represents tasks in a timeline, with clear labels for task duration and the person responsible for each task