Meter Dashboard - Copy this React, Tailwind Component to your project
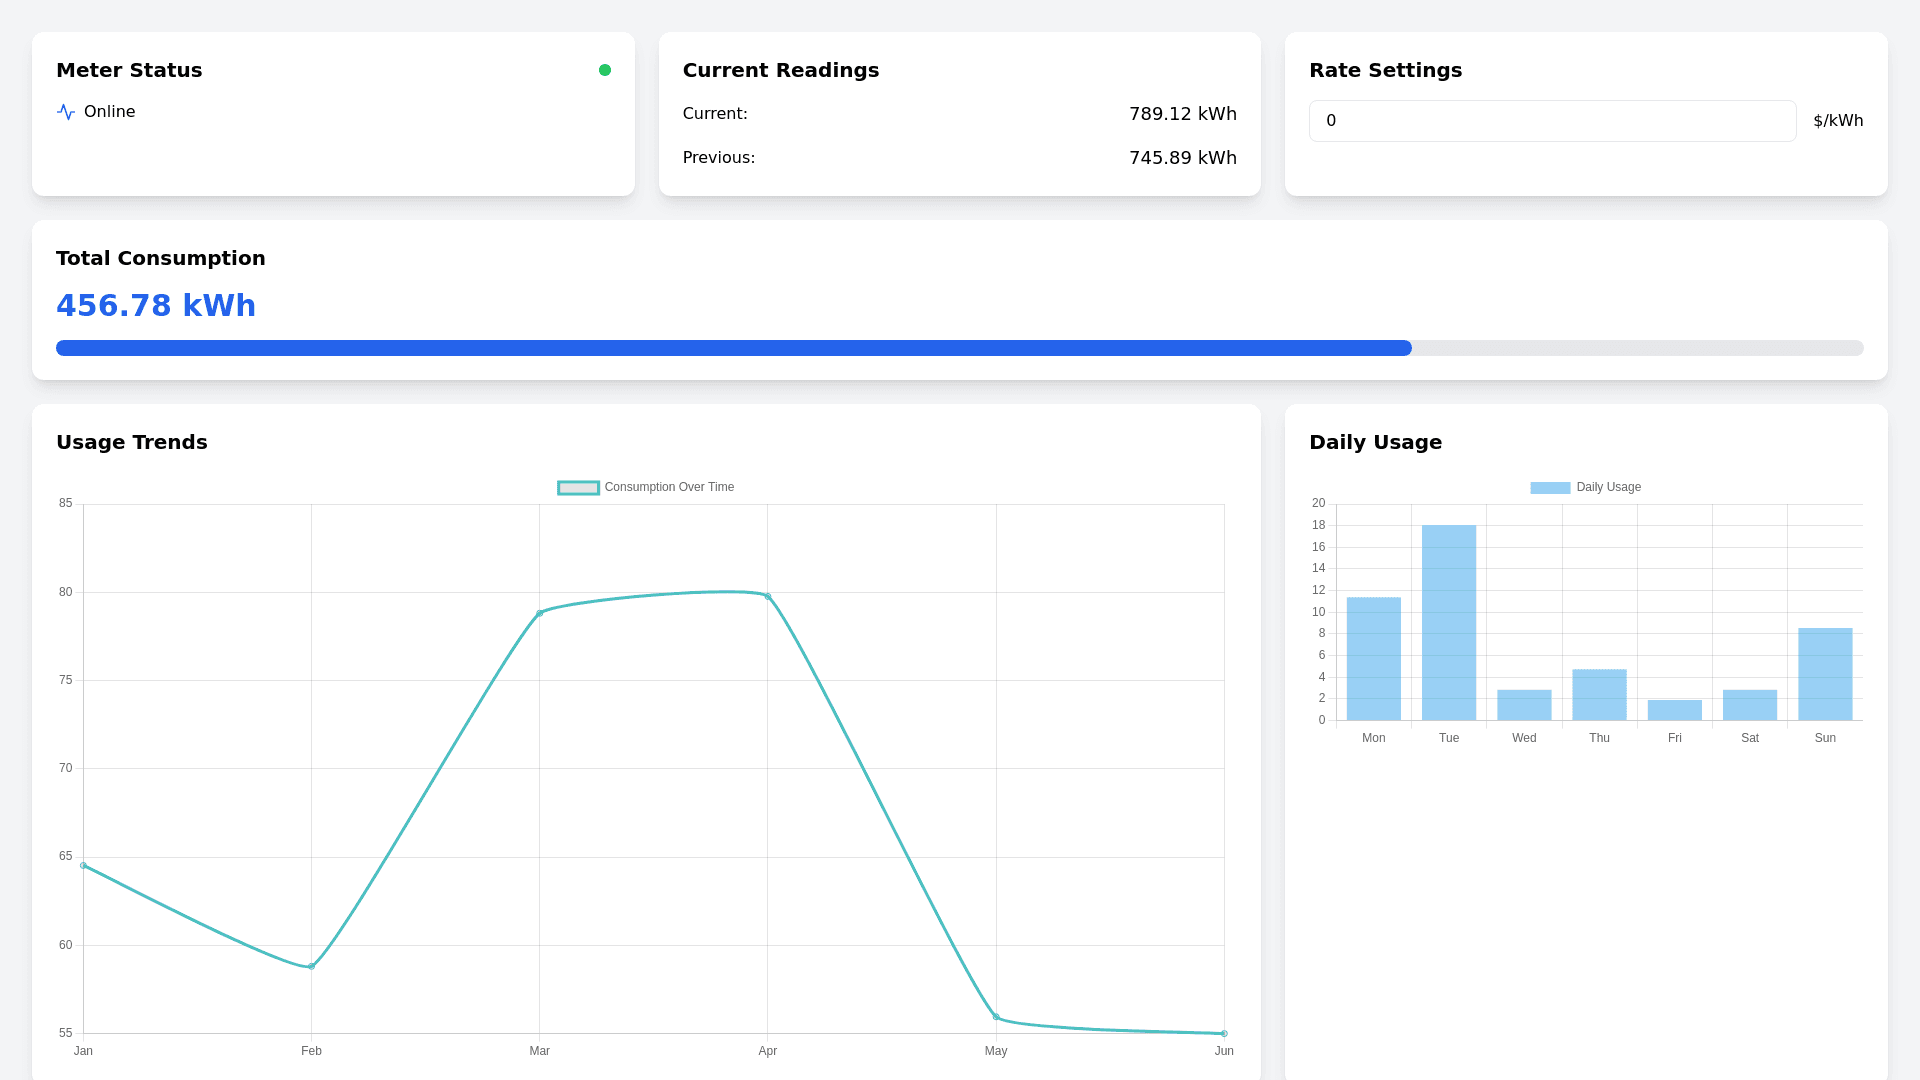
Home Screen (Dashboard) Meter Number: Displayed at the top for easy identification. Meter Status: Shown next to the meter number using an indicator light to represent the status, such as: <span class="status indicator online"></span> Online. Current Reading: Highlighted prominently in the center, showing the current meter reading in kWh, e.g., Current Reading: 1500 kWh. Current Rate: An input field for the user to enter the current electricity rate, e.g., Current Rate: <input type="number" value="5"> TWD/kWh. Total Consumption: Displayed below the current reading, showing the cumulative electricity consumption, e.g., Total Consumption: 20000 kWh. Data Chart Data Chart (Recent Week): A chart displaying the data for the recent week, with three quick selection buttons above the chart to switch between different time ranges: Daily Last 7 Days Last 1 Month Historical Data Filter Function: In the historical data section, a date filter allows the user to select specific time periods to view data: Filter Date: <input type="date"> to <input type="date"> Historical Data Chart: Displayed below the filter function, showing the historical data based on the selected date range. Communication Status Communication Status Indicator: An indicator light displayed at the bottom of the page to show the current communication status, e.g., <span class="status indicator connected"></span> Connected.