Industrial Cooling Dashboard - Copy this Html, Bootstrap Component to your project
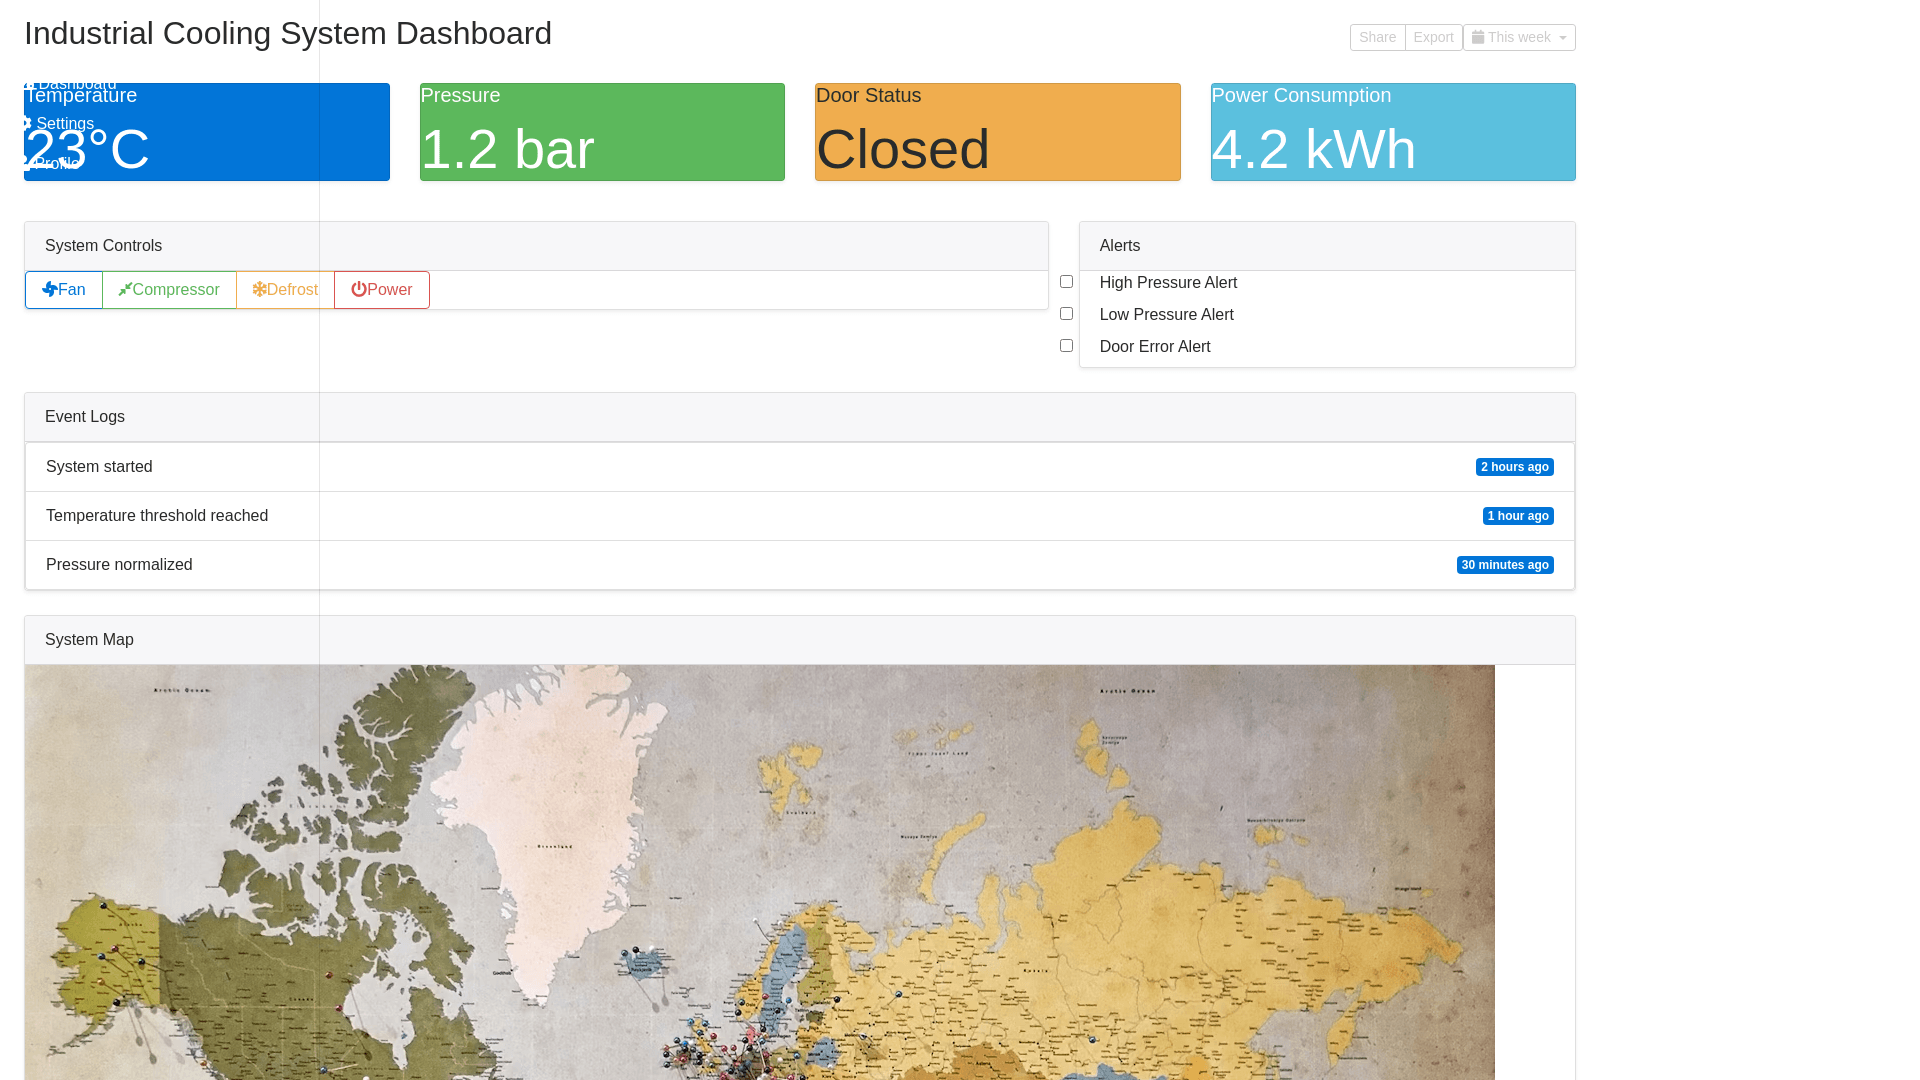
Design a clean, user friendly dashboard for an industrial cooling system management web app. The dashboard should have a modern, minimalistic layout with dark blue and gray tones. The main screen should provide key controls for the cooling systems, including fan, compressor, defrost, and main power. Display real time sensor data such as temperature, pressure, and door status in a visually appealing format, like gauges, charts, or graphs. Use intuitive toggle switches to manage alerts for high/low pressure, door errors, and other critical system notifications. The interface should be responsive for both web and mobile devices, ensuring smooth usability across different screen sizes. Offer light/dark mode options for user preference. Include a user account management section with settings to control notifications, manage access permissions, and configure system thresholds (e.g., temperature limits, pressure tolerances). Key components: Main Control Panel: Fan, compressor, defrost, and main power control buttons. Real time Data Section: Gauges or graphs showing live sensor readings for temperature, pressure, and door status. Alerts Section: Toggle switches for high pressure, low pressure, and door error alerts. Event Logs: A section displaying a timeline of past events and system errors. Map View: If applicable, a global or regional map showing the operational status of cooling systems across different locations. User Profile/Settings: User account management, notification preferences, and light/dark mode switching. The design should prioritize a clutter free experience, ensuring that users can quickly access critical controls and monitor data without being overwhelmed by unnecessary elements.
