Investment Dashboard - Copy this React, Tailwind Component to your project
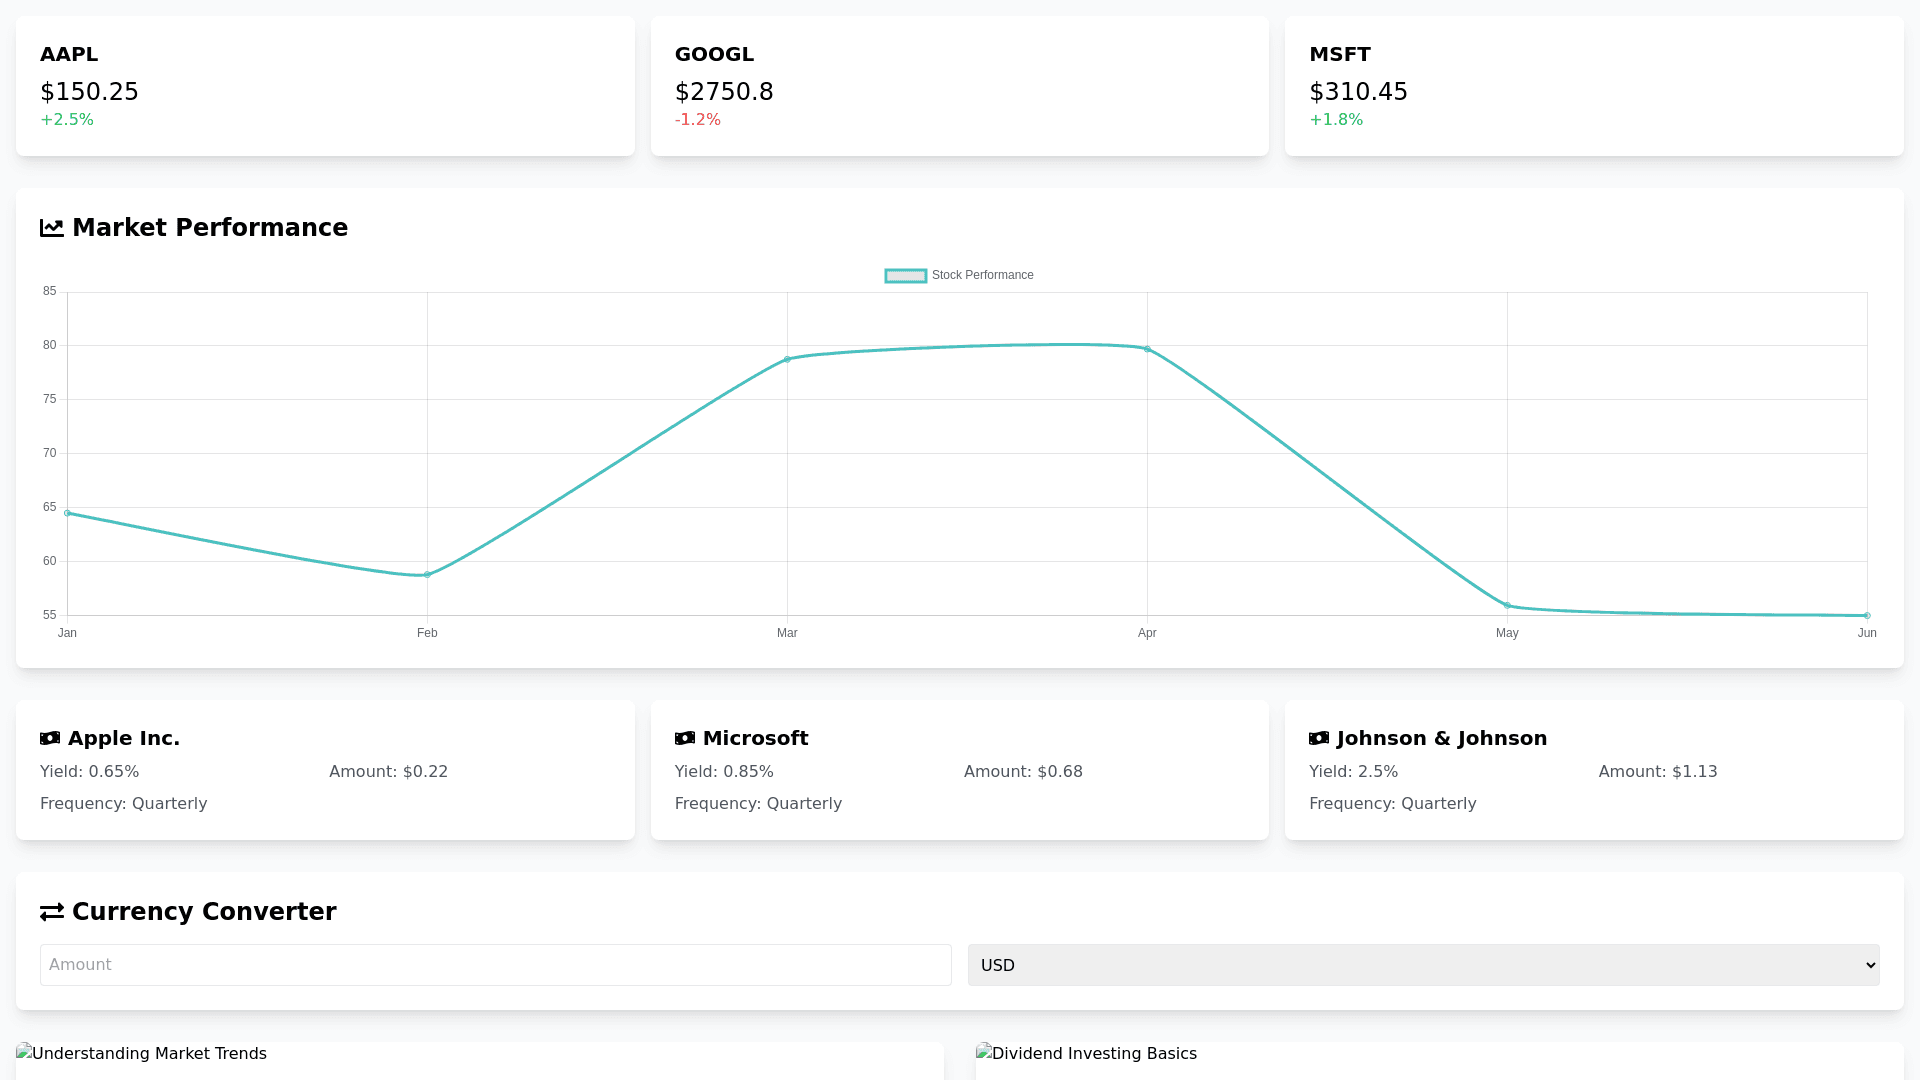
App Description: The Investment Management App offers a comprehensive and modern platform for users to track, analyze, and manage their investments across various asset classes, including stocks, ETFs, real estate funds, BDRs, and cryptocurrencies. With an intuitive interface and minimalist design, the app provides real time quotes, interactive charts, detailed financial analyses, and more. App Objective: Empower users to make informed financial decisions by providing clear, up to date, and customizable tools and information, helping them manage and optimize their investments efficiently and securely. Main Features of the App: Real Time Quotes: Display real time quotes for stocks, ETFs, real estate funds, BDRs, and cryptocurrencies. Information such as current price, percentage change, trading volume, and opening/closing prices. Historical Data & Customizable Timeframes: Allows users to view historical data with customizable timeframes (daily, weekly, monthly, yearly). Interactive charts that help users analyze asset performance over time. Dividend Information: Dividend payment history. Information about dividend yield and upcoming dividend dates. Currency Conversion & Exchange Rate Data: Real time currency conversion with exchange rates. Historical currency conversion data for trend analysis. Inflation & Selic Rate Analysis: Historical charts with inflation and Selic rate data, with analyses of their impact on investments. Company Financials: Balance sheets, income statements, financial ratios (P/E, ROE, profit margins). Detailed company summaries. Interactive Charts & Technical Analysis: Interactive line and bar charts. Technical analysis tools, such as moving averages and RSI. Customizable Alerts & Notifications: Set up price alerts, dividend reminders, earnings announcements, and other financial events. Financial Education & Support Content: Articles, guides, and educational content about finance, investing, and the financial markets. Light and Dark Themes: Toggle between light and dark themes for a comfortable visual experience in different environments. App Components and Visual Style: Top Navigation Bar: Fixed at the top with access to the app’s main pages, notifications, and settings. Financial Data Cards: Display stock quotes and financial data in interactive, clean blocks with visual indicators for gains/losses. Data Entry & Configuration Forms: Customizable input fields and validated user configuration options. Action Buttons: Styled with Tailwind CSS for responsiveness and ease of interaction. Dynamic Charts & Visualizations: Market charts with smooth animations and interactive controls for customization. Color Palette: Main colors: white (#FFFFFF), dark gray (#2D2D2D), blue (#007AFF), green (#34C759), red (#FF3B30). Typography: Fonts: "Inter", "Roboto", or "Open Sans" with clear hierarchy for titles, subtitles, and body text. Libraries Used: React for building the user interface. Tailwind CSS for fast and modern styling. React Router for navigation. Axios for HTTP requests. Redux or React Context for state management. react i18next for internationalization. Chart.js or Recharts for charting. React Notifications for alerts. Day.js or date fns for date manipulation. Multilingual Compatibility: Internationalization (i18n) System: Integration with react i18next for translating texts and adapting date, time, and currency formats. Language Selector: Users can manually switch languages within the app. Content Adaptation: All app messages, buttons, and text will be available in multiple languages. Technical Configuration Summary: Main Frameworks: React + Tailwind CSS. Backend & API Integration: Integration with financial APIs for quotes, market history, and economic data (e.g., Alpha Vantage, Yahoo Finance API, CoinGecko). Responsive Design: Fully responsive design for mobile, tablet, and desktop devices.
