Dashboard - Copy this React, Tailwind Component to your project
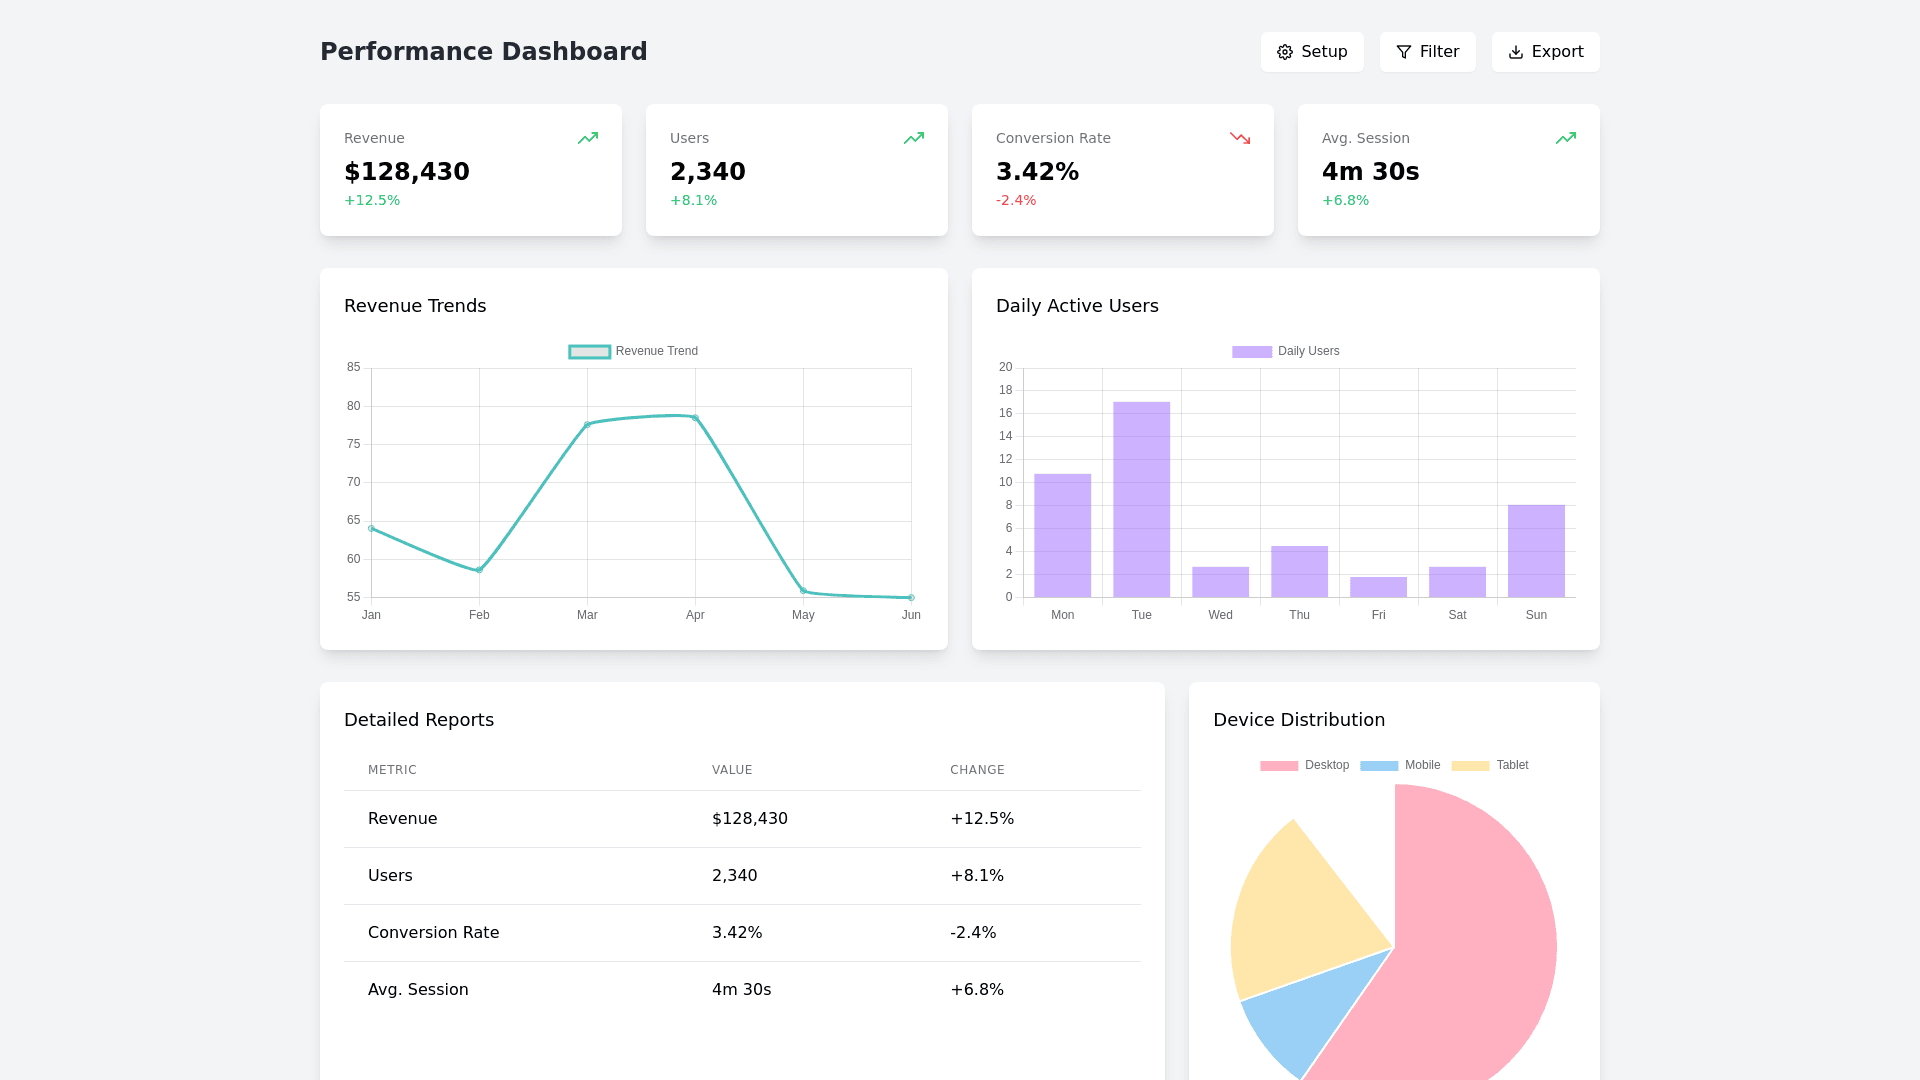
### **KPI Tracking & Advisory Features and Functions** #### **Features:** 1. **Custom KPI Setup:** **KPI Definition:** Allow users to define custom KPIs (Key Performance Indicators) relevant to their business, such as revenue growth, profit margin, customer acquisition, or operational efficiency. **Customizable Metrics:** Users can set specific metrics for each KPI, such as target values, time frames, and data sources. **Multiple KPI Categories:** Enable users to organize KPIs into different categories (e.g., Financial KPIs, Operational KPIs, Sales KPIs, etc.) for better management and reporting. **Flexible Data Sources:** Integrate with different data sources, such as accounting software, CRM tools, and project management platforms, to automatically pull data for KPI tracking. **Thresholds & Targets:** Set minimum, maximum, and ideal thresholds for KPIs, allowing users to track their progress toward goals. 2. **KPI Tracking Dashboard:** **Visual KPI Dashboard:** A dynamic dashboard showing all tracked KPIs, displayed in a visually appealing and easy to understand format (e.g., gauges, bar graphs, pie charts). **Real Time Tracking:** Display KPIs in real time, with automatic updates as new data is integrated. **Trend Visualization:** Show the historical performance of KPIs over time, highlighting trends and fluctuations (e.g., 30 day, 60 day, 90 day comparisons). **Data Filtering Options:** Allow users to filter KPIs by date range, category, or performance status (e.g., on track, off track, at risk). **Alerts for KPIs:** Set up alerts for KPIs that are falling behind or exceeding expectations. Send notifications or alerts when a KPI exceeds or falls below the target range. **Comparative Benchmarks:** Compare current KPI performance against industry standards or internal historical data to provide context. 3. **AI Generated Recommendations:** **Performance Analysis:** Use AI to analyze KPI performance and automatically identify areas where the user’s business could improve (e.g., high costs, low sales, operational inefficiencies). **Actionable Insights:** Provide actionable recommendations for improving KPI performance, such as adjusting strategies, reallocating resources, or optimizing processes. **Predictive Recommendations:** AI can suggest potential actions based on predictive analytics, forecasting how specific changes (e.g., increasing marketing spend) might impact KPIs in the future. **Goal Setting Support:** Help users set more achievable goals based on past KPI performance and industry trends, adjusting targets as needed. **Personalized Advisory:** Provide tailored advice depending on the user’s business type, industry, and specific KPIs, ensuring the recommendations are relevant and effective. 4. **KPI Reports and Exporting:** **Report Generation:** Automatically generate detailed KPI reports, summarizing the performance of each tracked metric, historical trends, and recommendations. **Export Options:** Allow users to export KPI reports in various formats such as PDF, Excel, or CSV for offline review or sharing with stakeholders. **Scheduled Reports:** Enable users to schedule automated KPI reports to be generated and sent to them or other team members at regular intervals (e.g., weekly, monthly). 5. **Collaboration & Sharing:** **Team Access:** Provide role based access to the KPI dashboard, allowing users to collaborate with team members. Different permissions can be set for different roles (e.g., admin, manager, viewer). **Sharing Capabilities:** Allow users to share their KPI dashboard or reports with team members or external stakeholders via a direct link or email. **Commenting & Notes:** Enable team members to leave comments or notes on specific KPIs for internal collaboration and discussion. ### **KPI Tracking & Advisory UI Design (Text Description)** #### **Page Layout:** 1. **Header Section:** **Title:** "KPI Tracking & Advisory" at the top of the page. **Action Buttons:** "Add KPI" (a primary button for creating new KPIs). "Generate Report" (for generating reports based on selected KPIs). "Set Alerts" (a secondary button for configuring KPI threshold alerts and notifications). 2. **KPI Dashboard Overview:** **KPI Summary:** **Total KPIs Tracked:** Show the total number of KPIs being tracked (e.g., "5 KPIs Active"). **Performance Status:** Display the overall status of all KPIs, such as "X% on target," "Y% at risk," and "Z% exceeded." **Visual KPI Cards:** **Key Metrics Overview:** Display the top performing KPIs as large, visual cards showing the KPI’s current value, target value, and status (e.g., on track, exceeded target, at risk). **Graphical Representation:** For each KPI, show a mini chart or progress bar to visually represent performance (e.g., a gauge chart for financial KPIs, a line graph for sales KPIs). **Quick Filters:** Provide filters at the top for sorting KPIs by category, time period, or performance status (e.g., “Show KPIs that are off track”). **Trend Graph:** Display a graph showing the historical trends of selected KPIs over time (e.g., 30 day, 60 day, or 90 day trend). 3. **KPI Performance Insights:** **AI Generated Recommendations Section:** **Personalized Tips:** Display a list of AI generated insights, such as "Increase marketing budget by 10% to boost sales" or "Reduce operational costs by 15% to improve profit margins." **Actionable Steps:** Include specific recommendations for improving KPIs, with actionable steps that can be followed (e.g., "Optimize supply chain operations," "Focus on retaining existing customers"). **Forecasted Impact:** Show a projected impact of implementing the recommendations on the KPIs. **Priority Level:** Each recommendation could be tagged with a priority level (e.g., "Urgent," "Important," "Optional"). 4. **KPI Setup and Configuration:** **KPI Creation Form:** Allow users to create new KPIs by entering essential details: **Name and Description:** The name and description of the KPI. **Target Value:** Define the target value for the KPI. **Measurement Period:** Choose a time frame (e.g., weekly, monthly). **Data Source:** Connect to an external data source (e.g., CRM, accounting software). **Thresholds:** Set performance thresholds (e.g., acceptable range for the KPI). **Category:** Select or create a category for the KPI (e.g., Financial, Operational). **Save/Cancel Buttons:** Include buttons for saving the new KPI or canceling the setup process. 5. **KPI Reports Section:** **Report Viewing Panel:** Display a panel where users can view detailed reports for each KPI. **Export Options:** Buttons to export the report as a PDF, Excel, or CSV file. **Scheduled Report Settings:** A section to schedule automated KPI reports, specifying frequency (e.g., weekly, monthly) and recipients. 6. **Collaboration & Sharing Features:** **Team Access Management:** A section for managing user roles and access permissions for the KPI dashboard (e.g., admins, managers, team members). **Shareable Links:** Provide an option to generate a shareable link to the KPI dashboard or specific reports. **Comments and Discussions:** Enable users to add comments or discussion threads for collaboration on specific KPIs. ### **Styling:** **Primary Colors:** Use professional, business oriented colors like deep blues or greens for the main sections, with accents in lighter tones (e.g., light blue or grey) to highlight trends and alerts. **Typography:** Utilize modern, legible fonts for KPI values (e.g., bold for high priority KPIs) and clean fonts for the data and labels. **Icons:** KPI card icons for different categories (e.g., graph icon for financial KPIs, target icon for sales KPIs). Alert icons for KPIs that are off track. A recommendation icon for actionable insights. **Hover Effects:** Interactive buttons and KPI cards can have hover effects, such as a slight color change or elevation. **Responsive Design:** Ensure the KPI dashboard is responsive and works well on mobile and tablet devices, with collapsible panels and filters for smaller screens. This design aims to create a comprehensive, data driven experience for tracking and managing business performance through custom KPIs, powered by AI driven recommendations and insights to help users optimize their business strategies.