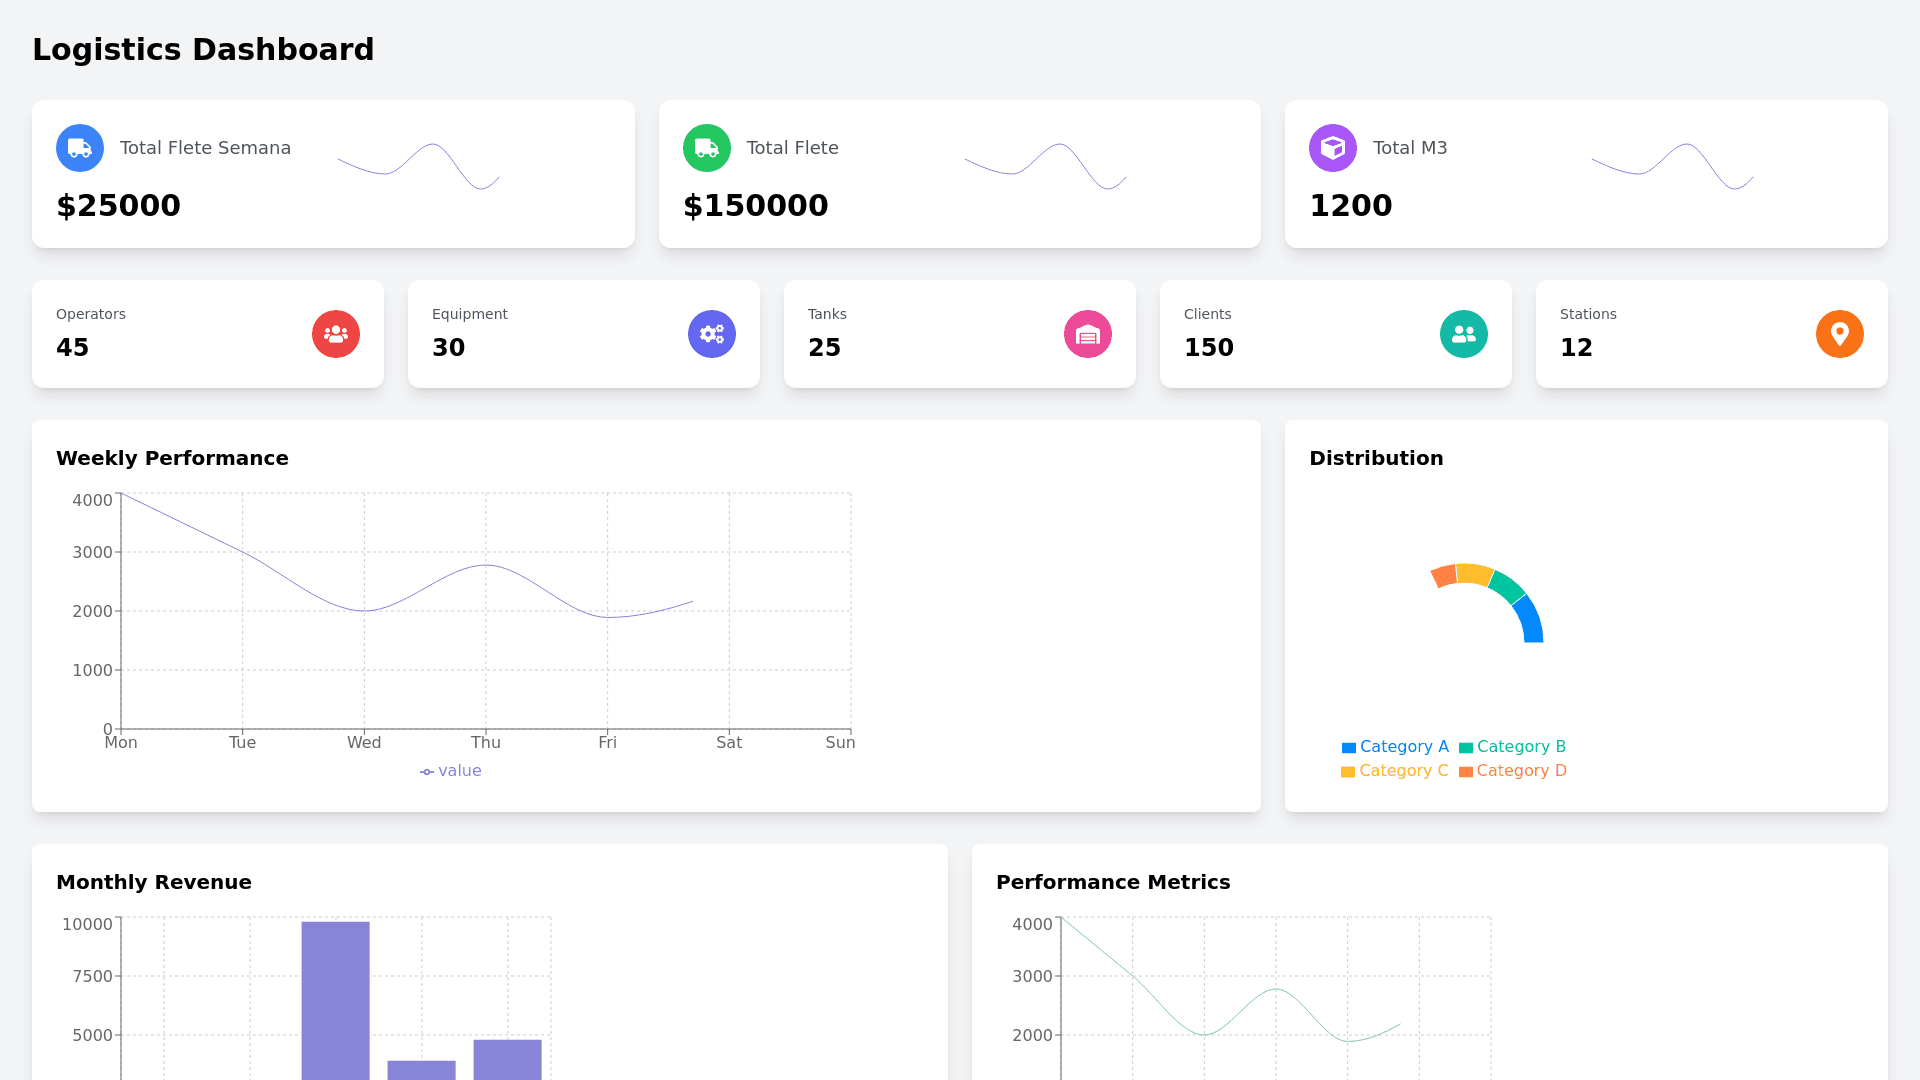
Logistics Dashboard - Copy this React, Tailwind Component to your project
Below the graphs I seek to put cards of the latest additions in operators, equipment, clients and stations. here are the types of each of them export interface Operador { id: string; image?: string; apellidos: string; nombres: string; telefono: string; email: string; nss: string; curp: string; ine: string; colonia: string; calle: string; externo: number; cp: number; tipoSangre: string; numLicencia: string; tipoLicencia: string; emisor: string; areaId?: string; area?: WorkArea; createAt: Date; updateAt: Date; } export interface Estaciones { id: string; name: string; image?: string; activo?: boolean; areaId?: string; area?: WorkArea; createAt: Date; updateAt: Date; } export interface Clientes { id: string; name: string; activo?: boolean; areaId?: string; area?: WorkArea; createAt: Date; updateAt: Date; } export interface Equipo { id: string; numEconomico: string; marca: string; modelo: string; year: number; serie?: string; placas?: string; m3?: number; tipoTanque?: string; activo?: boolean; estado: Estado; areaId?: string; area?: WorkArea; archivos: Archivo[]; tanque: Tanque[]; mantenimiento: Mantenimiento[]; Revisiones: Revisiones[]; createAt: Date; updateAt: Date; Evidencia: Evidencia[]; Certificado: Certificado[]; ArchivosVencimiento: ArchivosVencimiento[]; }