VP
Vikas Pattar
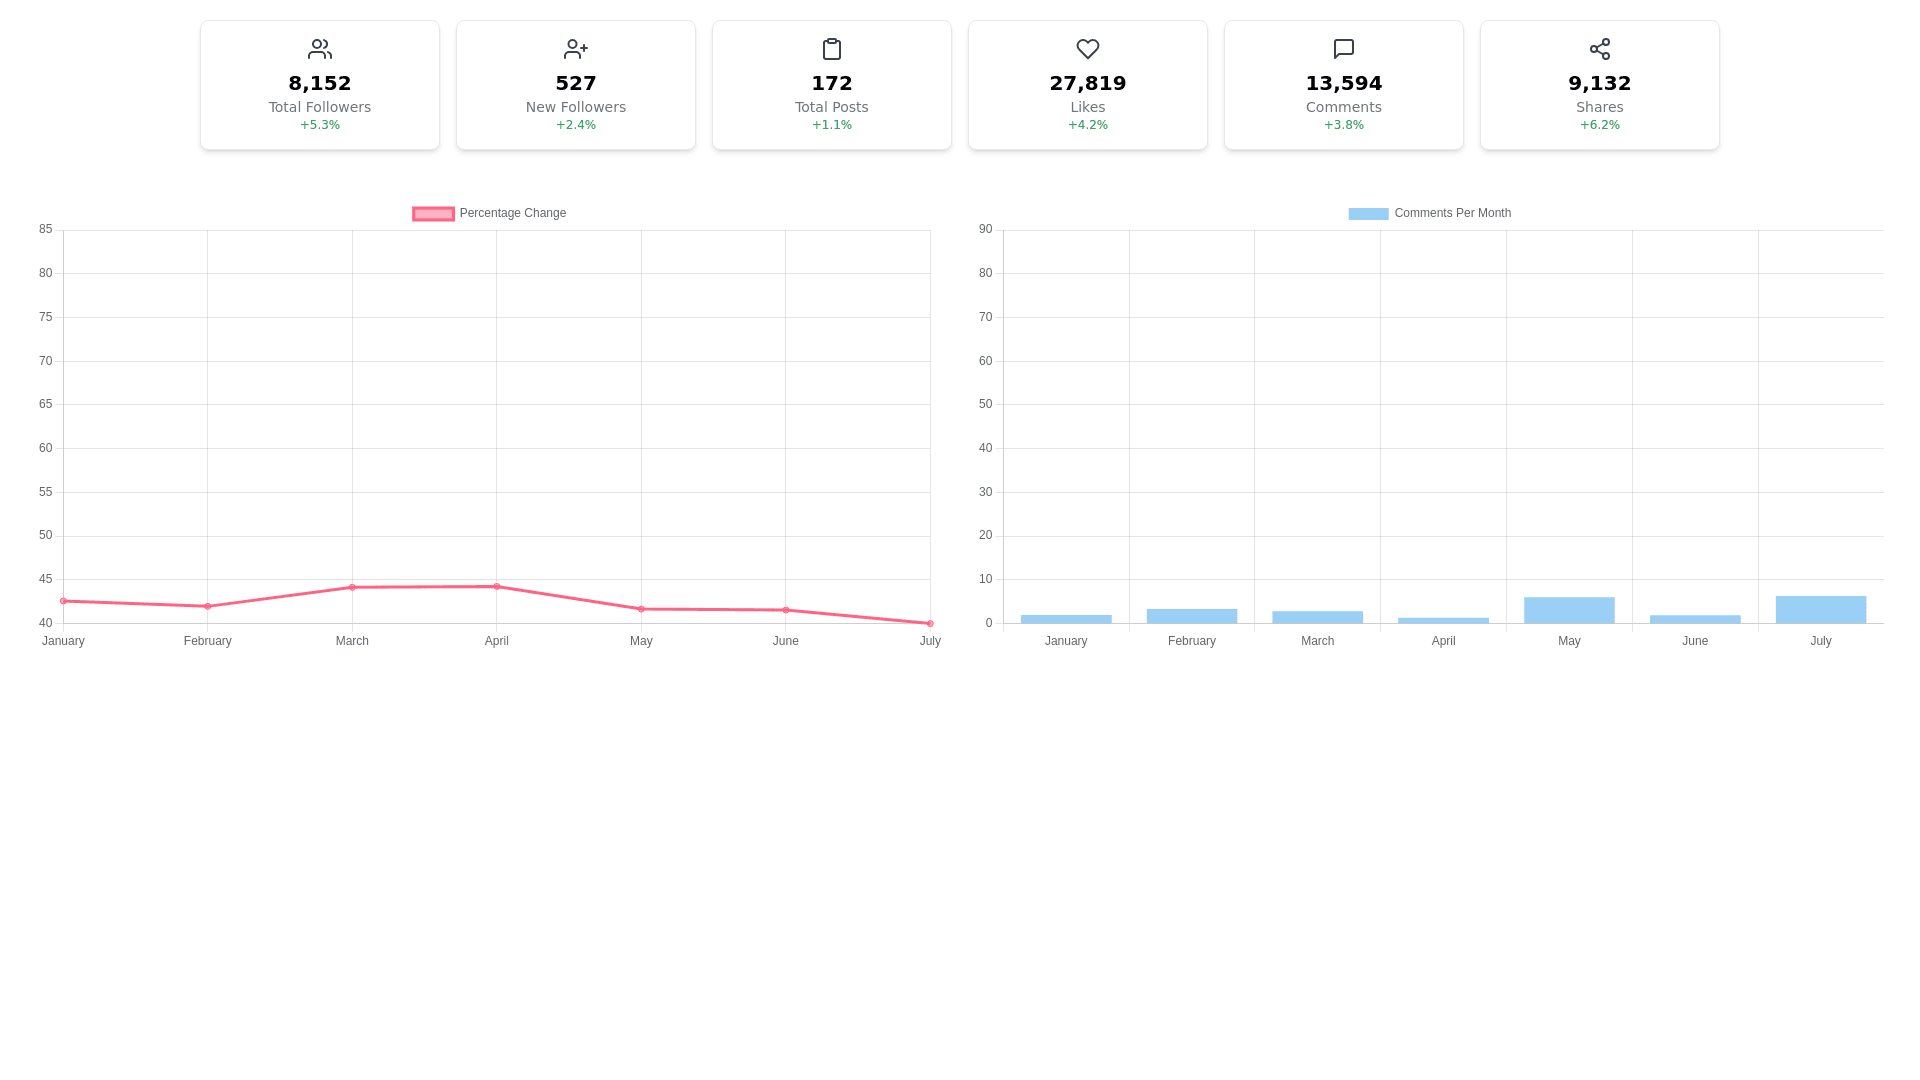
Stats Grid Component - Copy this React, Tailwind Component to your project
Add a line and bar graph side by side below the existing component. The line graph should display the percentage changes compared to the previous year, and the bar graph should display the number of comments per month. Use relevant dummy data for the graphs.
Prompt