A
Anonymous
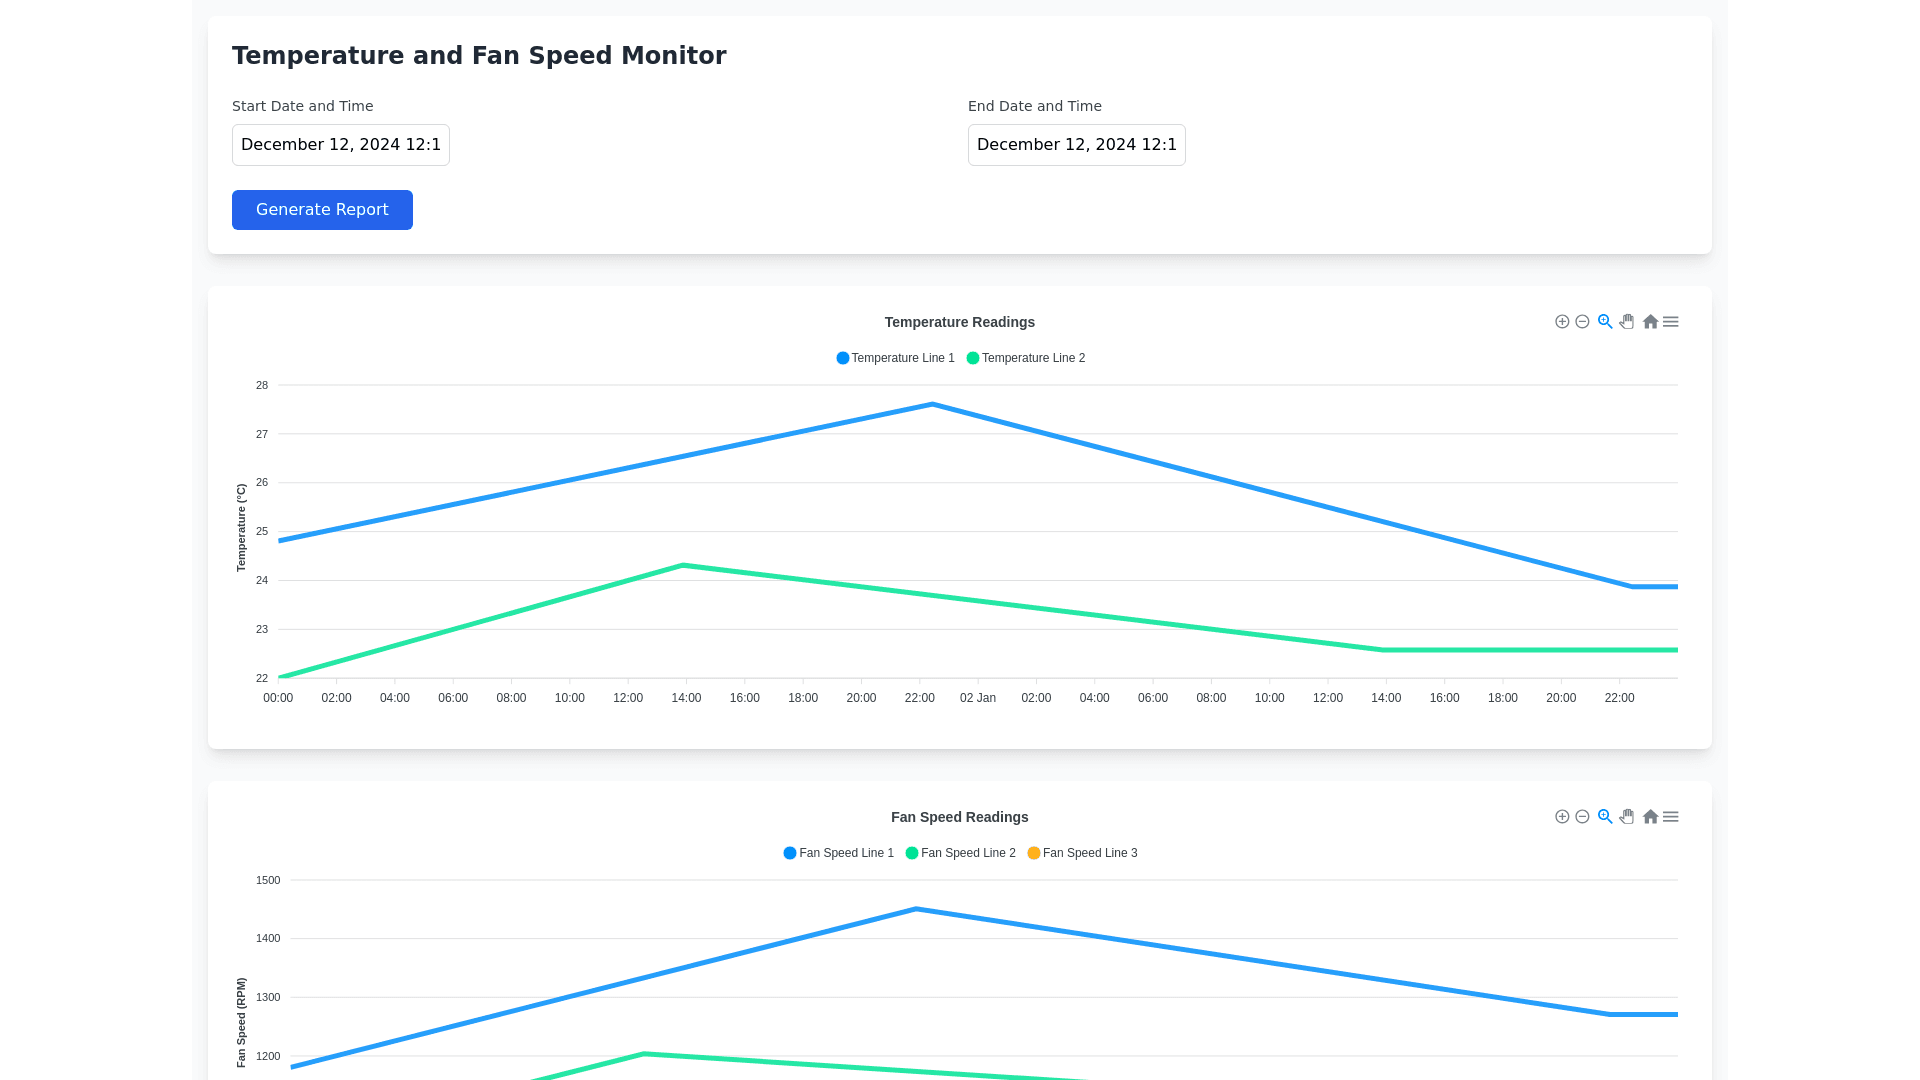
Temperature Fan Dashboard - Copy this React, Tailwind Component to your project
The-LINE-chart-interface-for-measuring-temperature-and-fan-speed-includes-2-input-fields-for-entering-time-including-day,-month,-year,-hour,-hour,-filtering-data-displayed-on-the-chart,-after-entering-the-full-time,-when-Press-the-"Report"-button,-the-graph-will-be-displayed,-the-temperature-graph-includes-2-graphs-(1-with-3-lines,-1-with-4-lines),-the-speed-is-3-lines.-The-data-will-include-value-and-timestamp.-(using-ApexChart-library).
Prompt