RA
Ruhul Ain
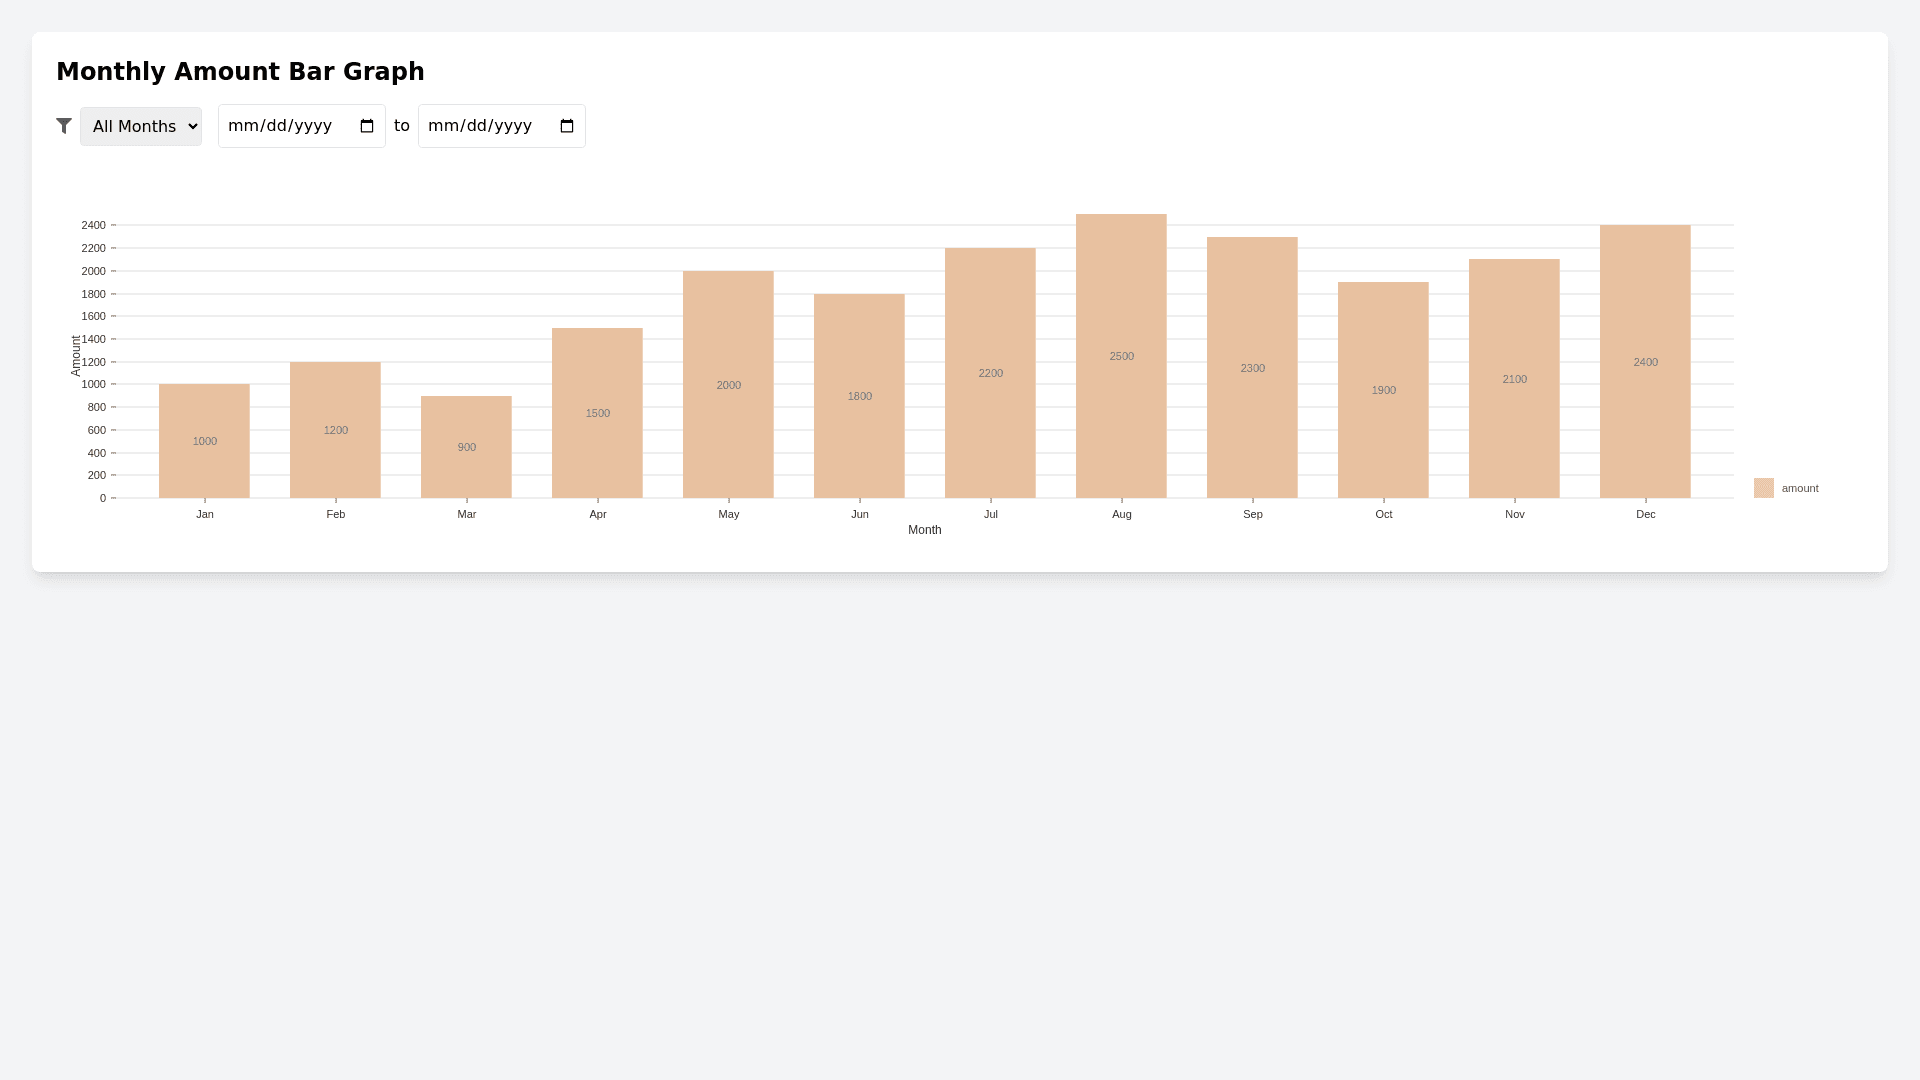
Bar Graph Component - Copy this React, Tailwind Component to your project
A bar graph of months in x axis and amount in y axis, first time display all month, if we filter on the basis of month only that month data will displayed, if we filter by date or date range of particular month display only that data. use nivo graph.
Prompt