NTĐ
Nguyễn Thế Đạt
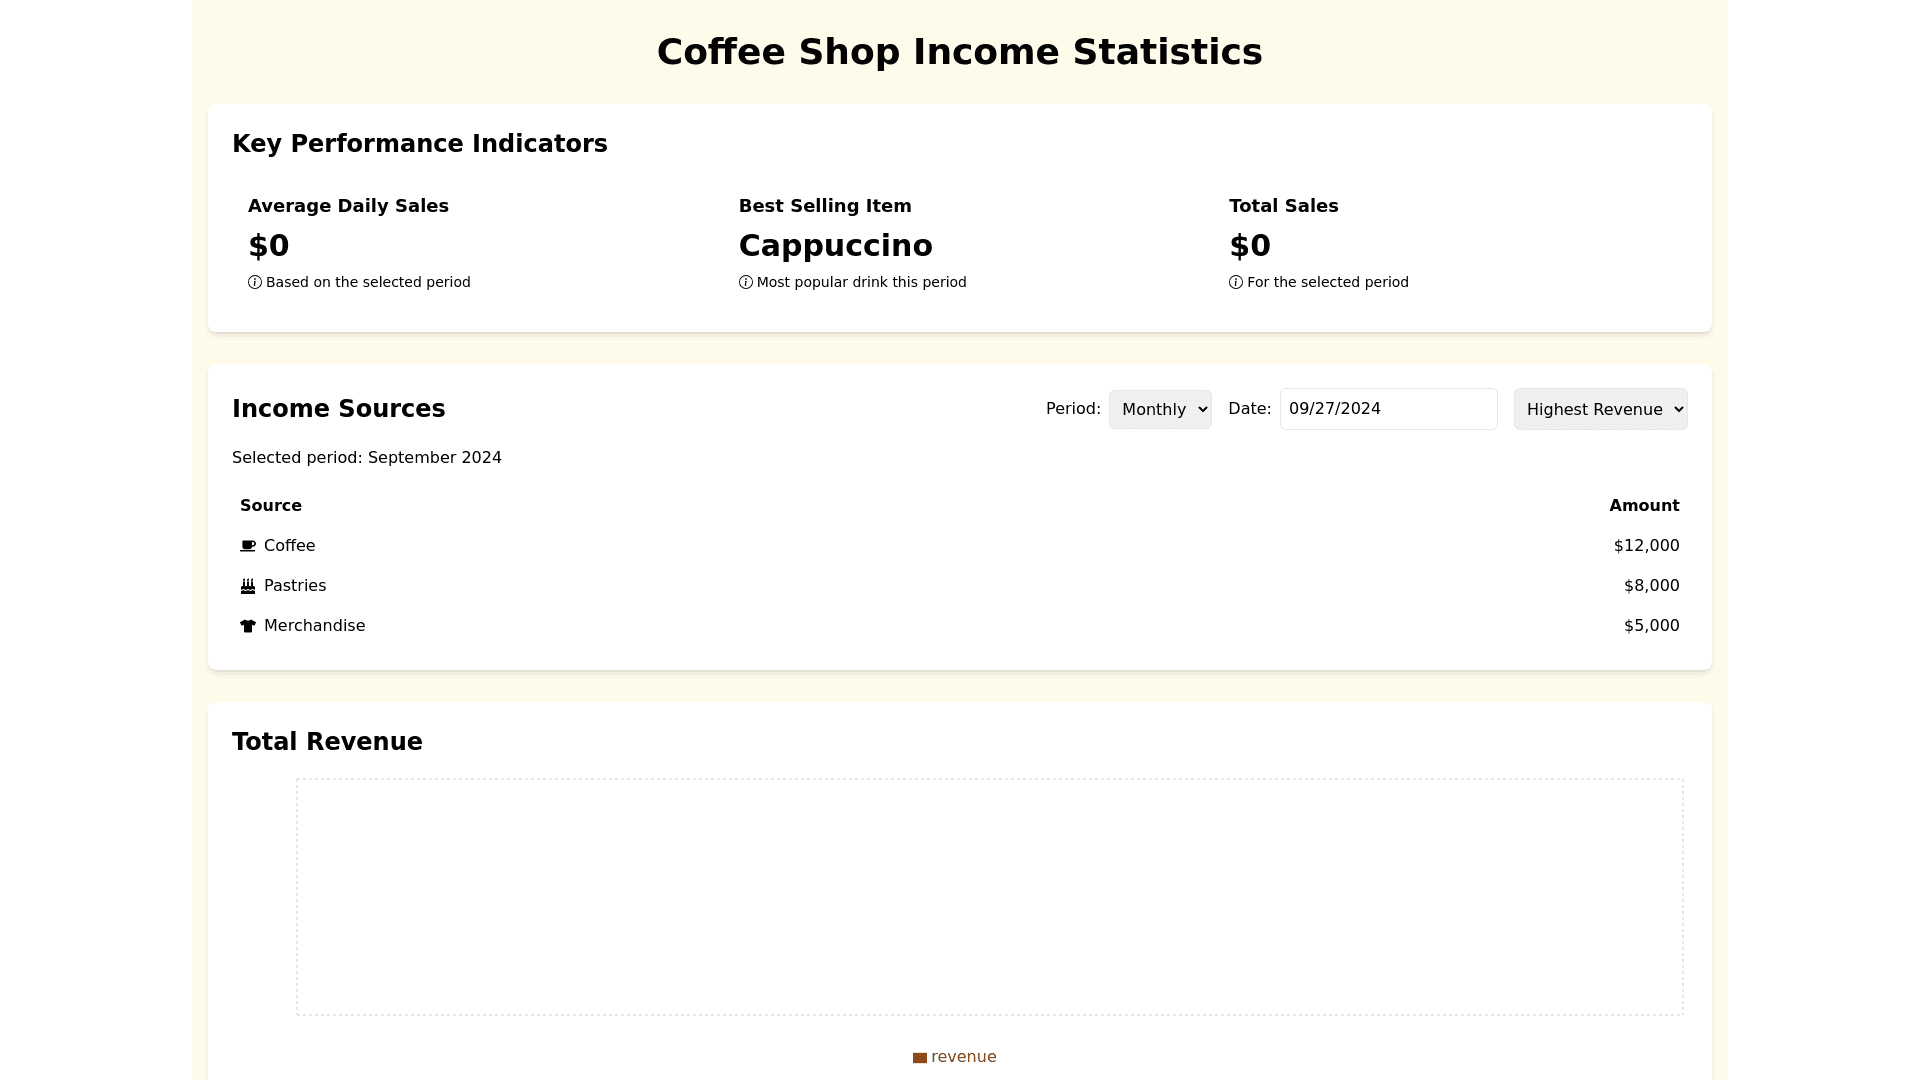
Coffee Shop Statistics - Copy this React, Tailwind Component to your project
the chart should be in month (trend of the month and every day), every chart is in 1 row, make the chart down, below the key performance, remove the customer satisfaction, the filter must let user choose which day, which week, which month (let user know this week is from which day to which day)
Prompt