TS
Tom Sroka
Chart Container - Copy this React, Mui Component to your project
change this to a line chart and change the data to represent a "Deal Velocity" report
Prompt
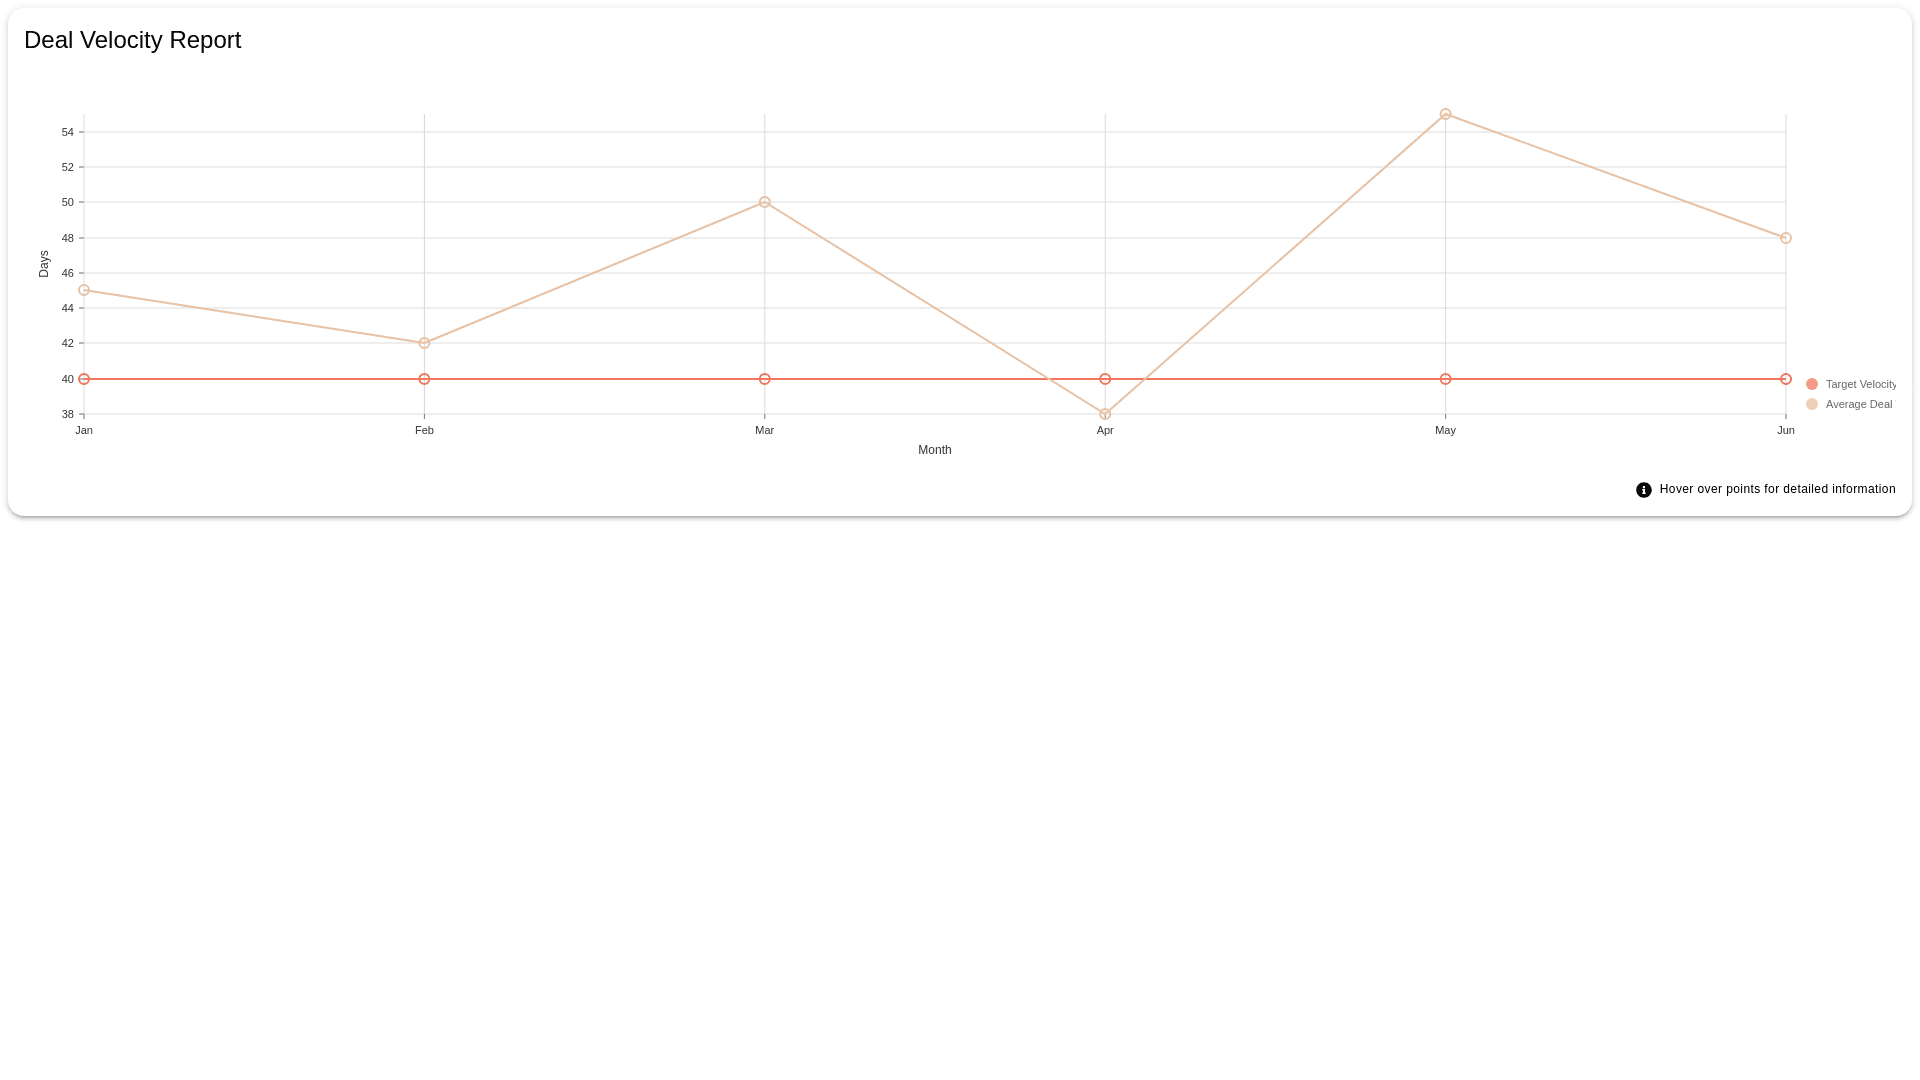
change this to a line chart and change the data to represent a "Deal Velocity" report