TS
Tom Sroka
Nivo Chart Component - Copy this React, Tailwind Component to your project
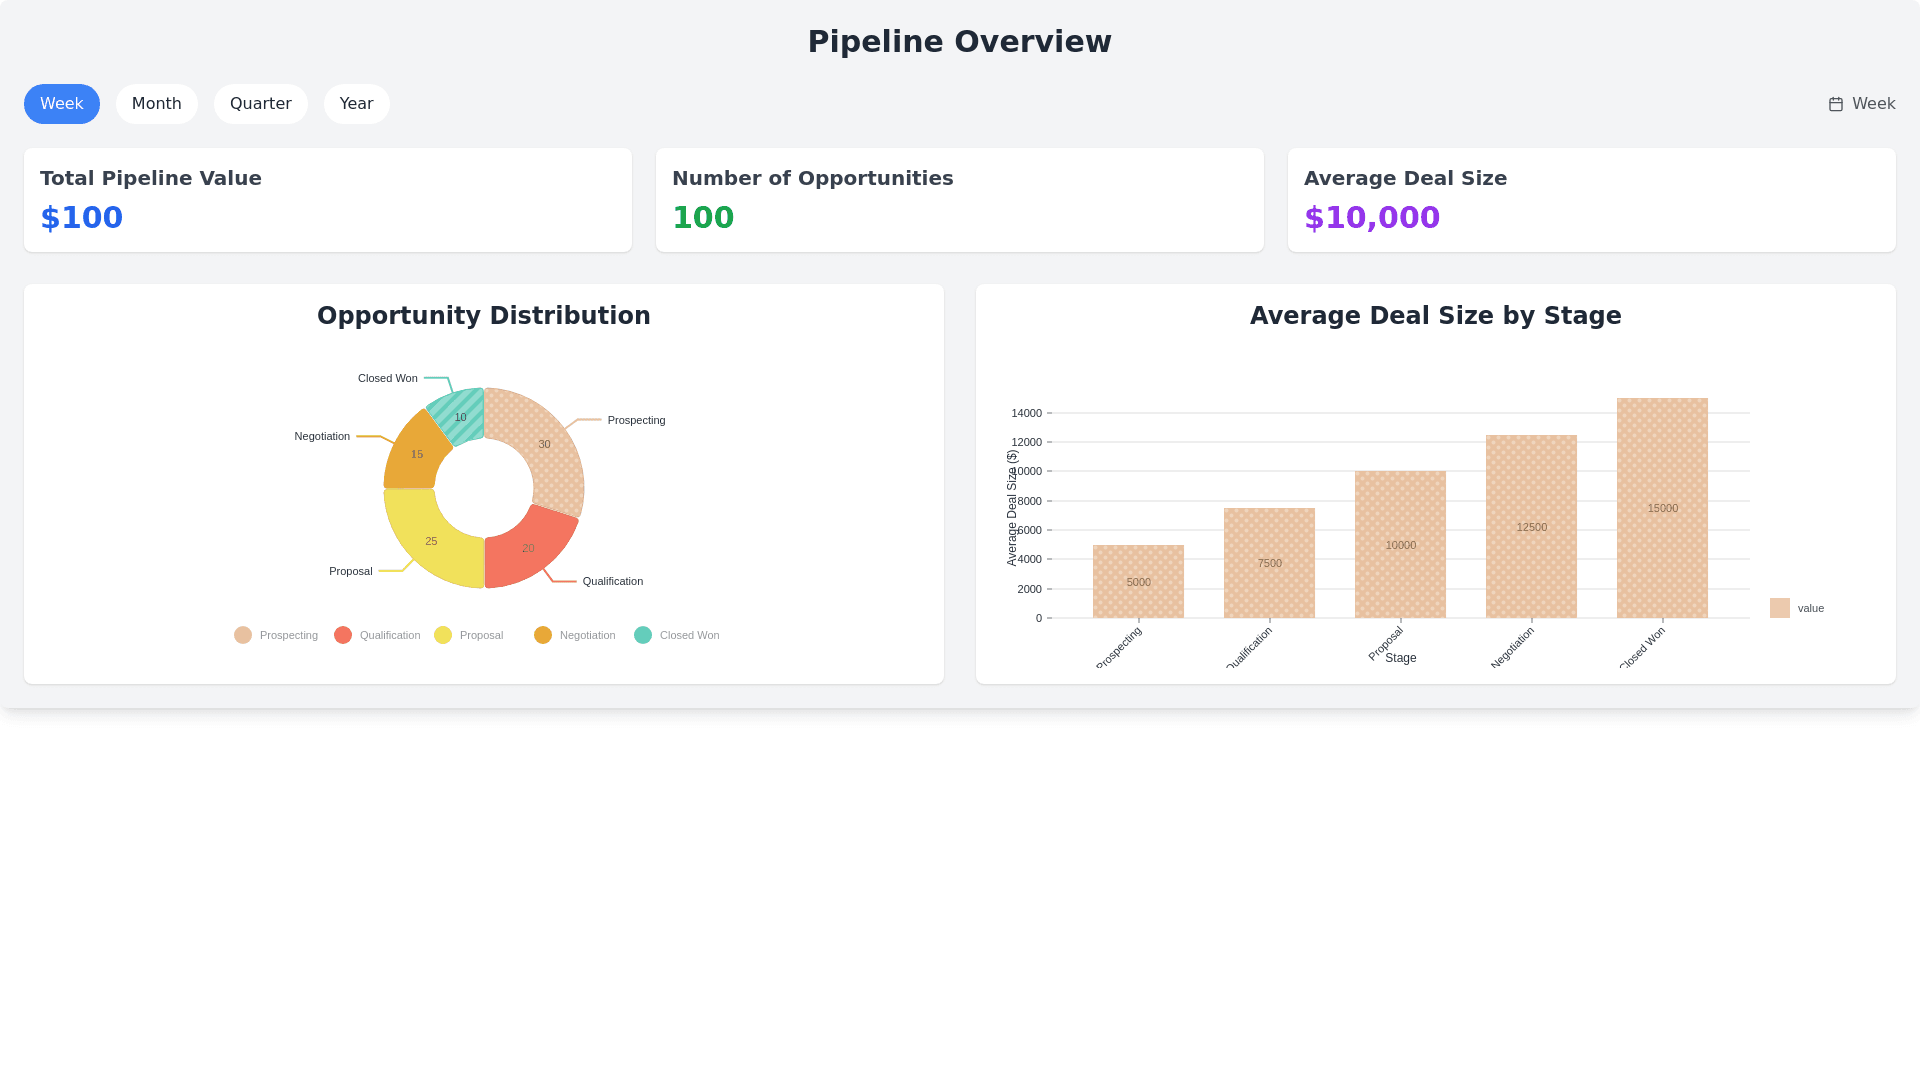
Create a @nivo chart with the following parameters: title: Pipeline Overview metrics: Total pipeline value, number of opportunities, average deal size. filters: Week/Month/Quarter/Year Visual Representation: A pie chart showing the distribution of opportunities across different stages with a total pipeline value and a bar chart for average deal size.
Prompt