Styled Paper - Copy this React, Mui Component to your project
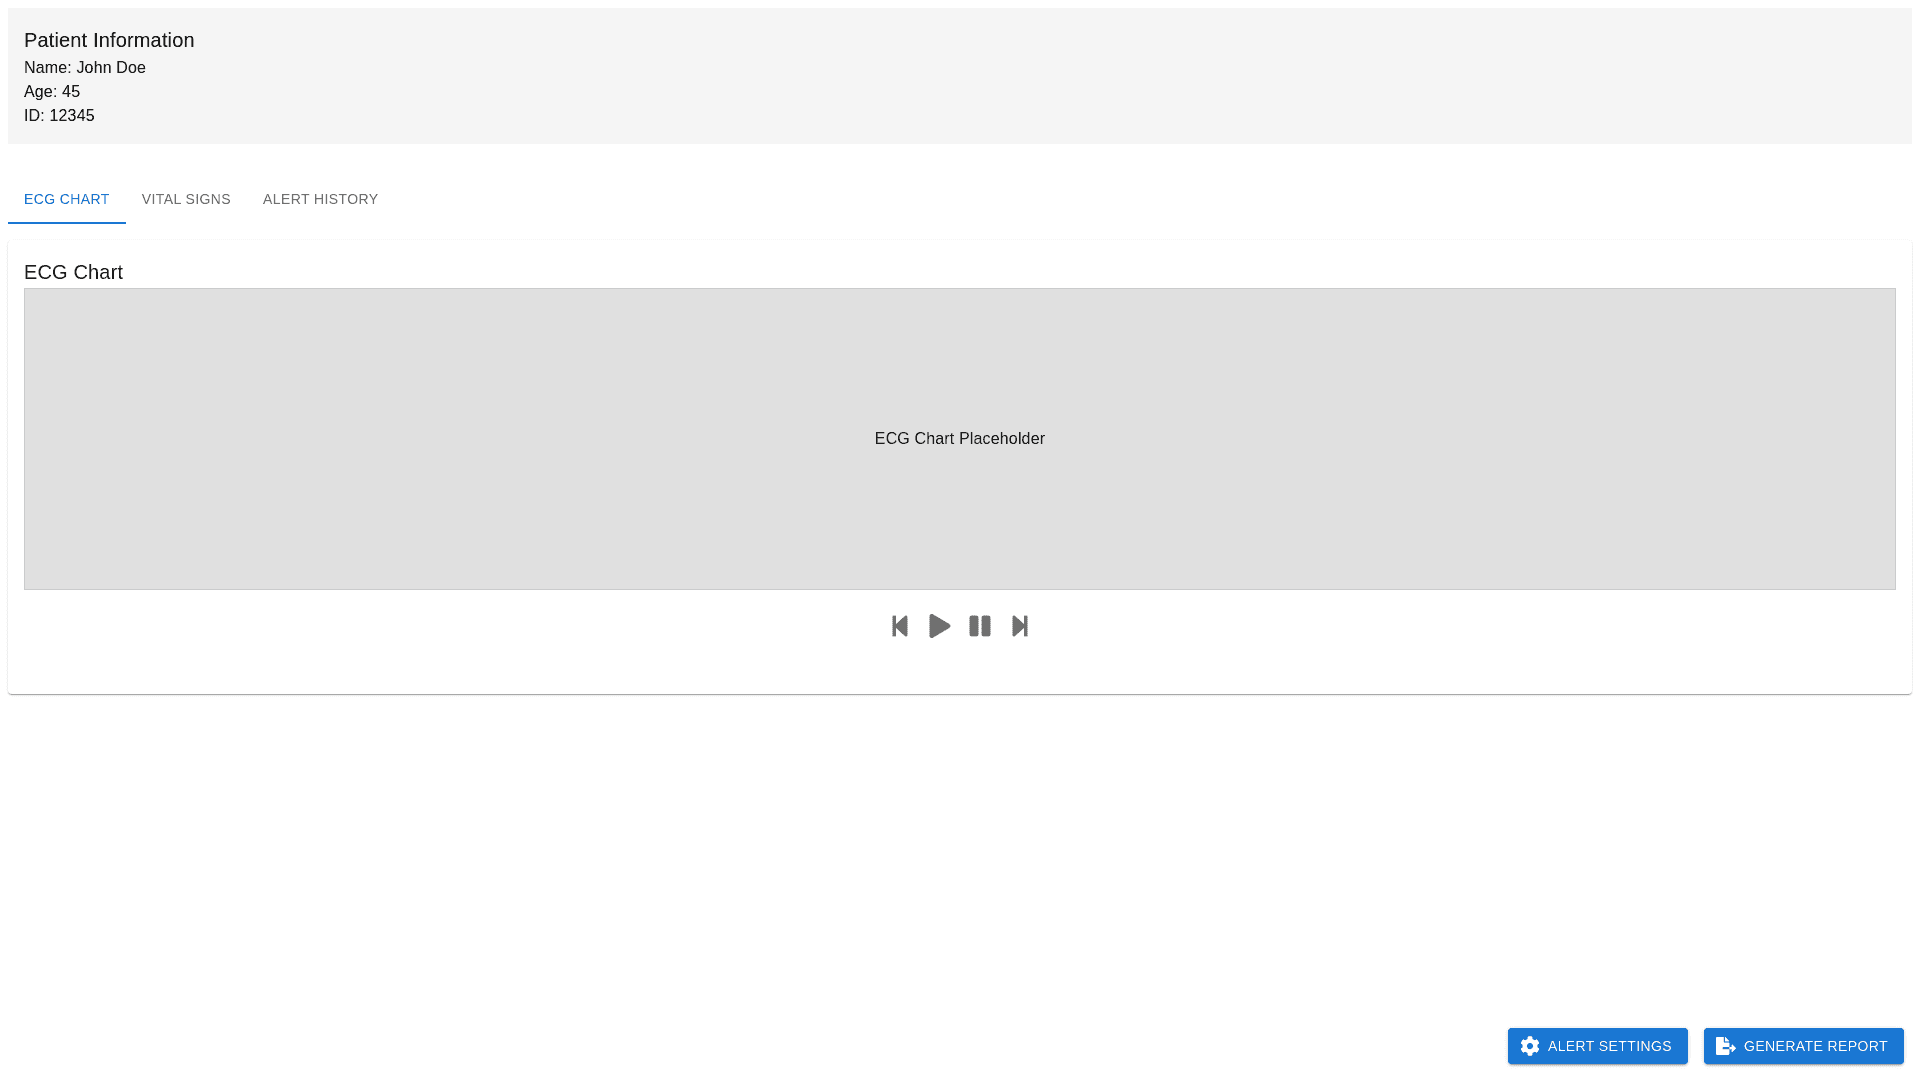
Develop Wireframes for Key Screens: Observation Dashboard: Layout: Main content area displaying the ECGChart and VitalSignsChart side by side or in a stacked format, depending on space. PatientInfoPanel positioned at the top or as a collapsible sidebar for quick access to patient details and recent lab results. AnnotationTools integrated directly into the charts for seamless interaction. PlaybackControls located beneath the charts for easy access. SignalTogglePanel available to the side or as an overlay to manage visible signals. Navigation: Utilize the existing sidebar on the left and maintain the breadcrumb and pivot (tabbed interface) as per your current layout. Ensure the Observations tab houses all these components cohesively. ECGChart Screen: Visualization: Implement the standard ECG grid with small and large squares. Default view set to x1 zoom level with a 10 second time window. Provide options for zooming, panning, and adjusting the time window. Interaction: Enable direct interaction for adding and editing annotations. Include markers and visual cues for alerts and critical metrics. VitalSignsChart Screen: Visualization: Display multiple vital signs (e.g., heart rate, blood pressure, SpO₂) simultaneously. Allow overlaying of signals with color coded lines and legends. Provide options to toggle individual signals on or off. Interaction: Support time synchronization with the ECG chart. Enable annotations similar to the ECG chart. AlertSettingsModal: Configuration: Simple and intuitive interface for setting up alerts. Fields to set thresholds, select vital signs, assign priority levels, and configure email notifications. Options to save and manage multiple alert configurations. AlertHistoryPanel: Layout: Accessible via a button or tab within the Observations section. Table or list view displaying alerts with columns for date, time, priority, type, and patient (if applicable). Features: Filters for patient, priority, date range, and alert type. Sorting options for each column. ReportGenerator Screen: Interface: Form or wizard to select data parameters, time frames, and report types. Options to include annotations, alerts, and patient information. Export: Buttons to export the report in PDF or HTML format. Preview feature to see the report layout before exporting.