Client Funds Overview - Copy this React, Tailwind Component to your project
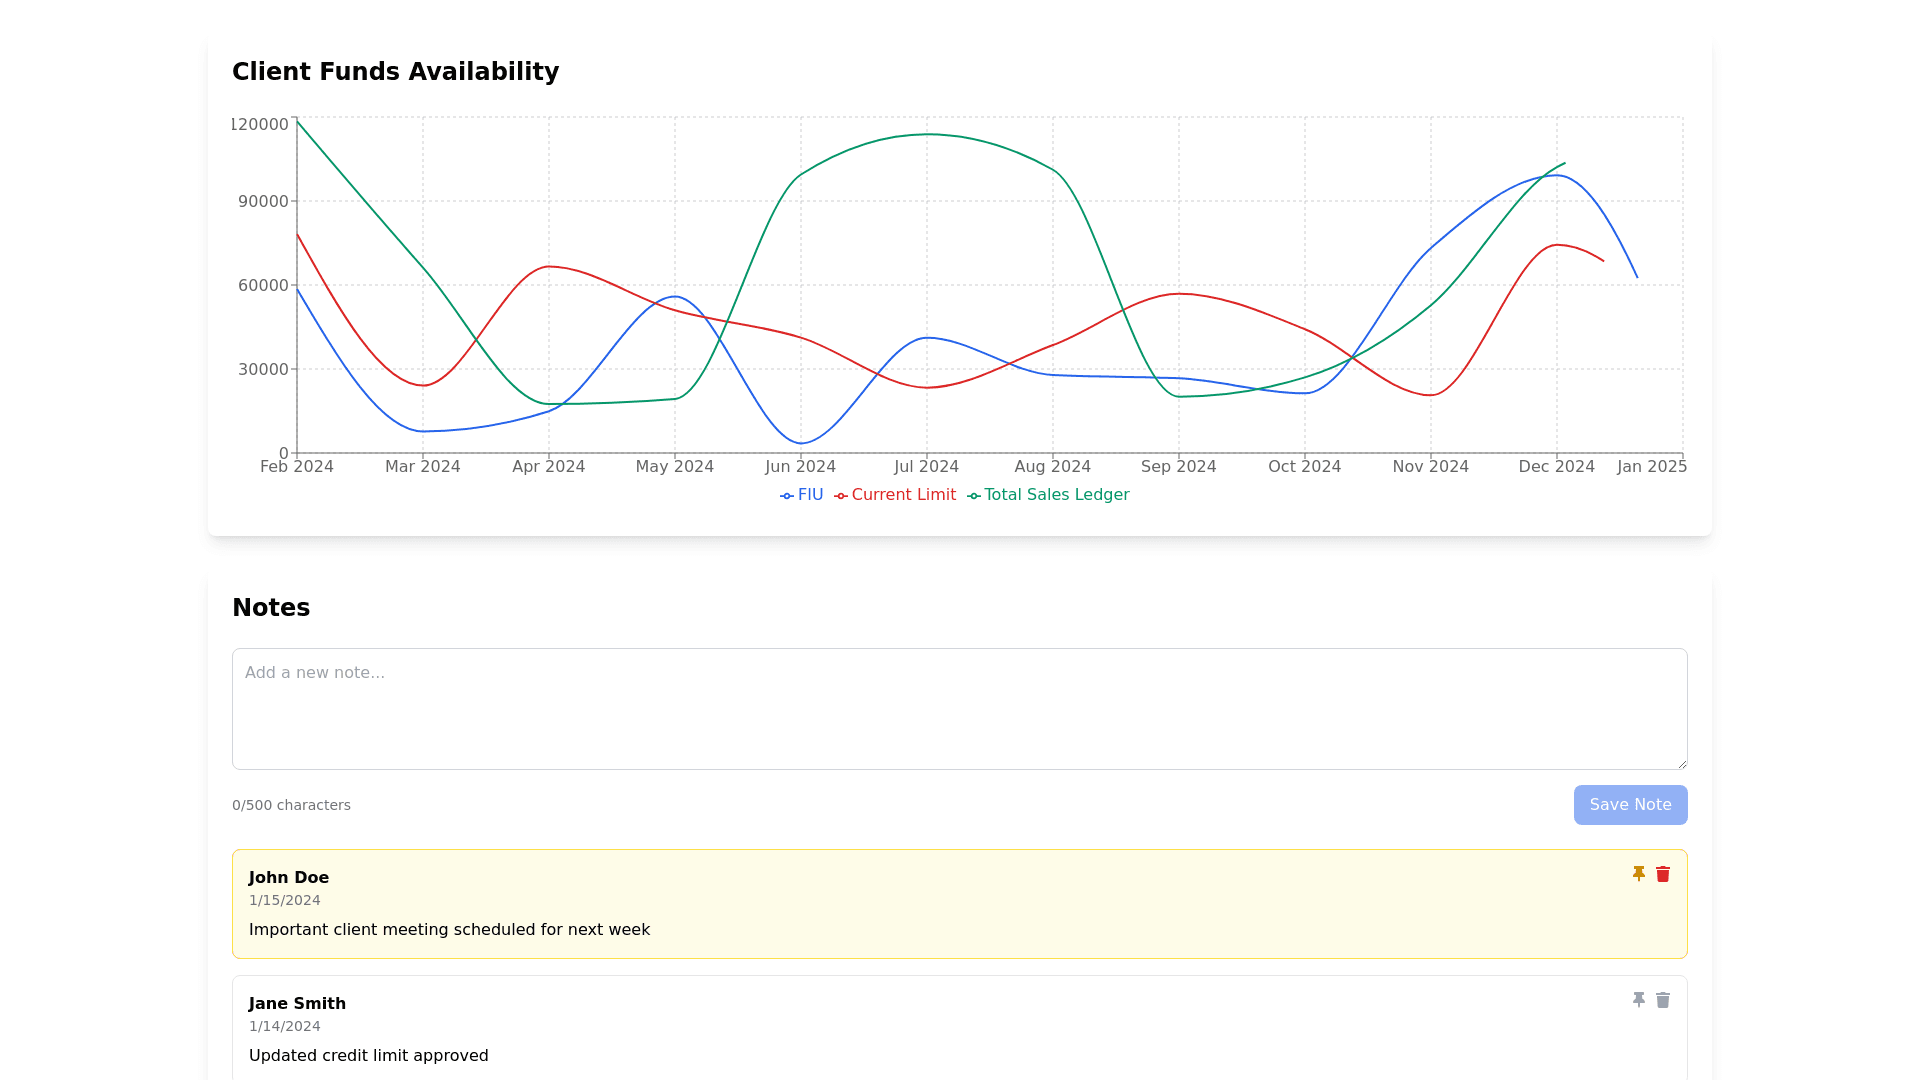
The Overview Tab is the default landing page. It display client funds availability well. Requirements Graph 1. Trending data is much easier for humans to understand when displayed in an image or graph. A line graph Horizontal axis defaults to 12 months, or max # of months since “Healthy” Vertical axis is $ and must be dynamic in value, with the maximum displayed value 1 unit higher than the maximum value plotted on graph. It calibrates to display all data at maximum size (could be $50,000, could be $2m) Shows trending FIU When hovering the curser over a point, the numerical data should display is small pop up. (ie. on FIU line, plot drawdowns and display date & value) Shows trending Current limit Shows trending total Sales Ledger (Total) This could appear full screen width, 2nd on the page Notes. With a larger portfolio and operations team, it is important that information regarding each client is communicated efficiently. The notes section will typically sit at the bottom of the page. Historic notes should be displayed prominently on the Overview tab New notes should be easy to create and save Useful to have the ability to “Pin” a note, so that it always appears at the top of the list The note author username and time stamp must be recorded and displayed. Free format text field, with save button.