Sidebar - Copy this React, Mui Component to your project
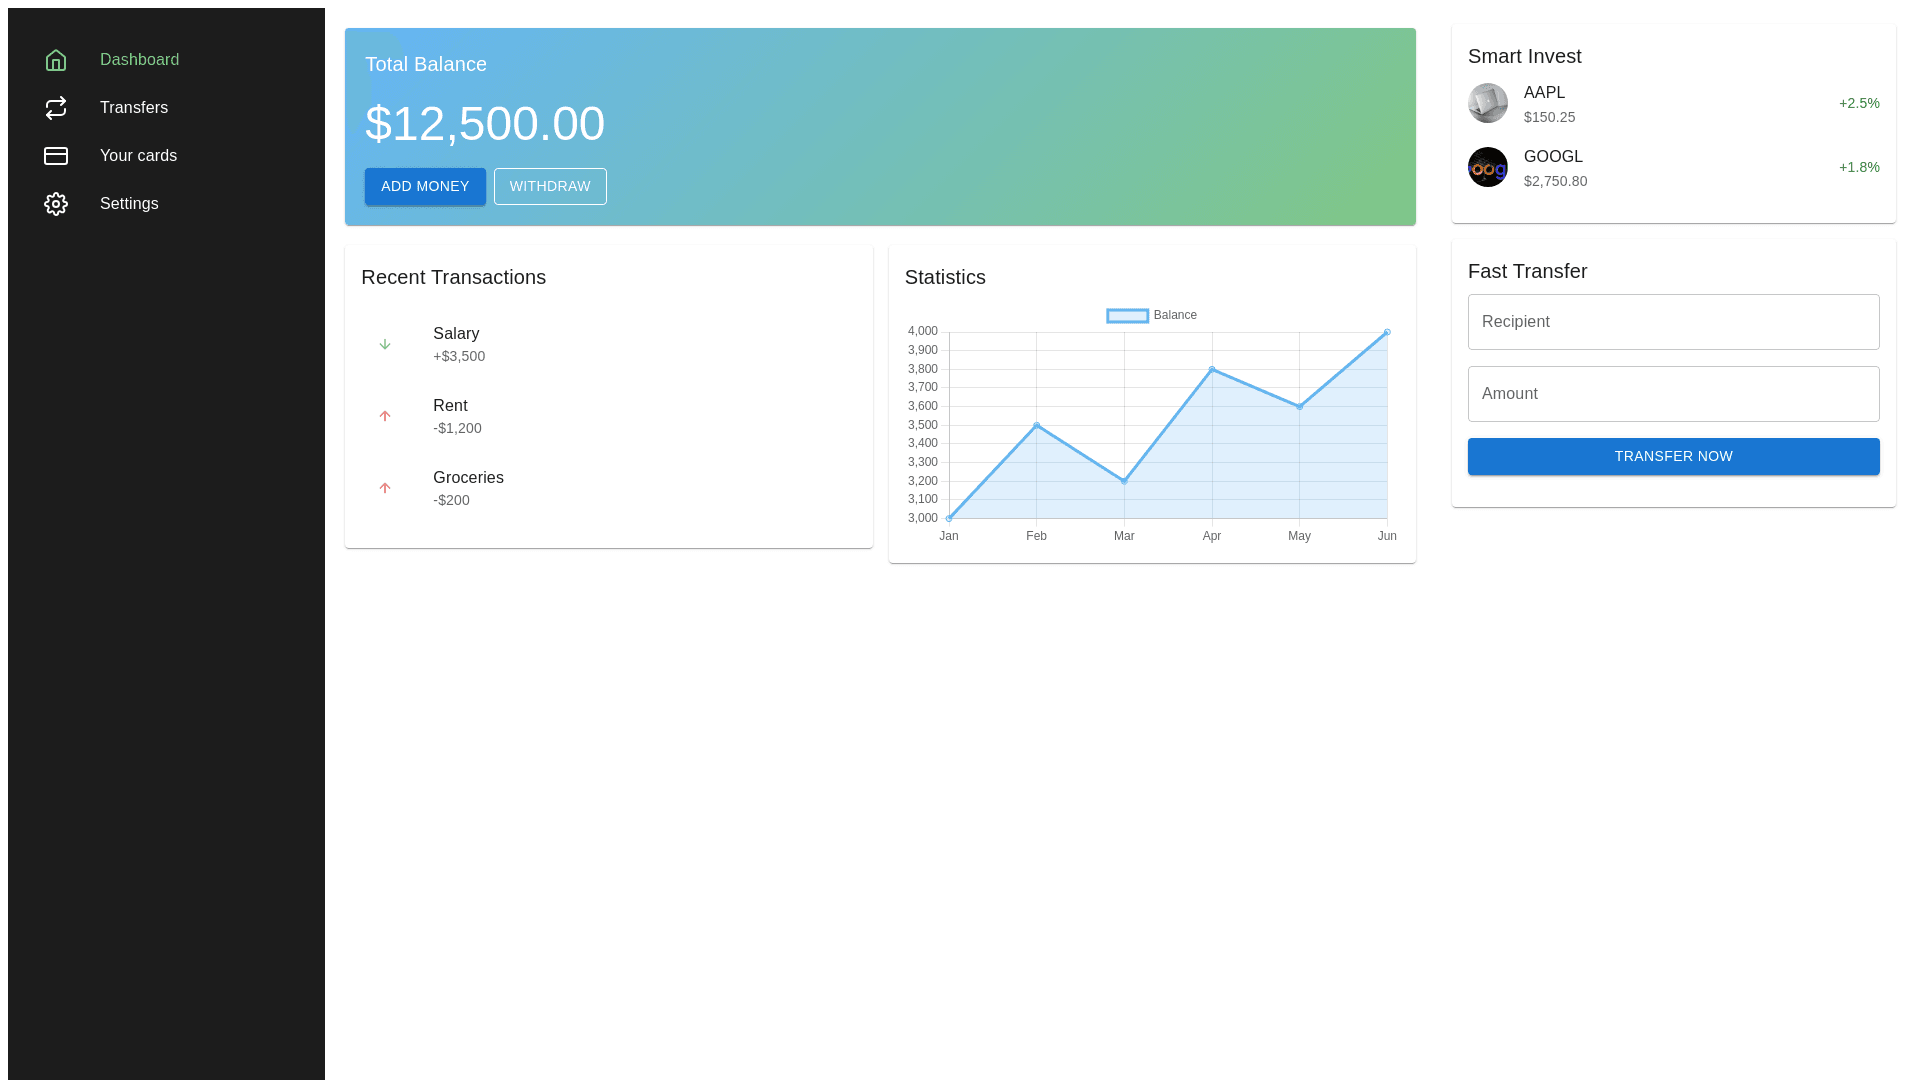
Create a Personal Financial Dashboard with the below characteristics and features: Layout Structure: General Structure: The layout appears to be based on a flexbox grid, divided into three main columns: Left Sidebar Contains navigation options. Main Content Area Includes account information, transactions, and statistics. Right Sidebar Contains "Smart Invest" options and "Fast Transfer" functionality. Semantic Segmentation: Left Sidebar: Coordinates: Starting from the left edge (x=0, y=0) and running vertically along the height of the layout. Width: Approximately 15% of the screen width. Elements: Contains navigation icons for "Dashboard," "Transfers," "Your cards," and "Settings." Visual Style: Dark background (#1C1C1C) with active icon highlights in a light teal color. Main Content Area: Coordinates: Centered in the layout, starting after the sidebar (x ~ 15% of screen width). Width: Approximately 50% of the screen width. Sections: Account Summary (Top): Card details with balance and action buttons. Transactions (Bottom Left): List of recent transactions with status indicators and amounts. Statistics (Bottom Right): Line graph showing spending or account trends. Right Sidebar: Coordinates: Rightmost column (x ~ 65% of screen width). Width: Approximately 35% of the screen width. Sections: Smart Invest: Lists popular stocks with price and percentage changes. Fast Transfer: Allows quick transfers with input fields and avatar selectors. Element Specific Bounding Boxes: Account Card (Main Content Top): Bounding Box: Centered horizontally with a card image occupying most of the width within its container. Dimensions: Width ~80% of container, with buttons for "Send," "Receive," "Copy," and "Block" aligned beneath. Color/Style: Card image has a gradient from light blue (#00C3FF) to green (#1CFF89). Transactions List (Main Content Bottom Left): Bounding Boxes: Individual transaction entries are vertically stacked. Elements: Each entry includes a directional arrow (green for income, red for expense), description, and amount. Spacing: 10 15px between transactions. Statistics Graph (Main Content Bottom Right): Bounding Box: Contains a line chart showing account trends with hover data points. Dimensions: Full width and height of its container. Gradient: The chart uses a blue gradient background that fades from dark to light from bottom to top. Smart Invest Section (Right Sidebar Top): Bounding Box: Fixed list of stocks with horizontal tabs for categories (Popular, Tech, etc.). Elements: Each stock shows the logo, name, price, and percentage change. Spacing: Approximately 20px between stock listings. Fast Transfer Section (Right Sidebar Bottom): Bounding Box: Contains user avatar selections, input fields for transfer details, and a "Transfer" button. Elements: Clear separation between "From" and "To" fields, with CVV and amount fields aligned side by side. Spacing: 15px between fields, with button padding around 20px. Hierarchy and Nesting: Left Sidebar is the main navigation container. Main Content Area acts as the primary focus with key sections (Account, Transactions, Statistics) organized in a hierarchical fashion. Right Sidebar groups secondary interactive elements (Smart Invest, Fast Transfer). Nested Elements: Buttons within the account summary and avatars within the fast transfer are nested for grouped functionality. Spacing and Relative Positioning: Padding/Margin: Consistent spacing (~10 20px) between main sections, creating a clean and organized look. Alignment: Left sidebar items are left aligned; main content is centered; right sidebar items are right aligned. Color and Gradient Details: Primary Background: Dark black (#0D0D0D). Highlight Colors: Teal (#1CFF89) and light green accents. Card Gradient: From light blue (#00C3FF) to green (#1CFF89) across the card. Text Colors: Primarily white (#FFFFFF) with secondary gray text for details (#A1A1A1). Transaction Indicators: Green (#1CFF89) for positive, red (#FF1C1C) for negative values. Gradient Characteristics: Account Card Gradient: Start: Top left with light blue. End: Bottom right with light green. Statistics Graph Gradient: Transition: Fades vertically from dark blue at the bottom to a lighter blue green near the top.