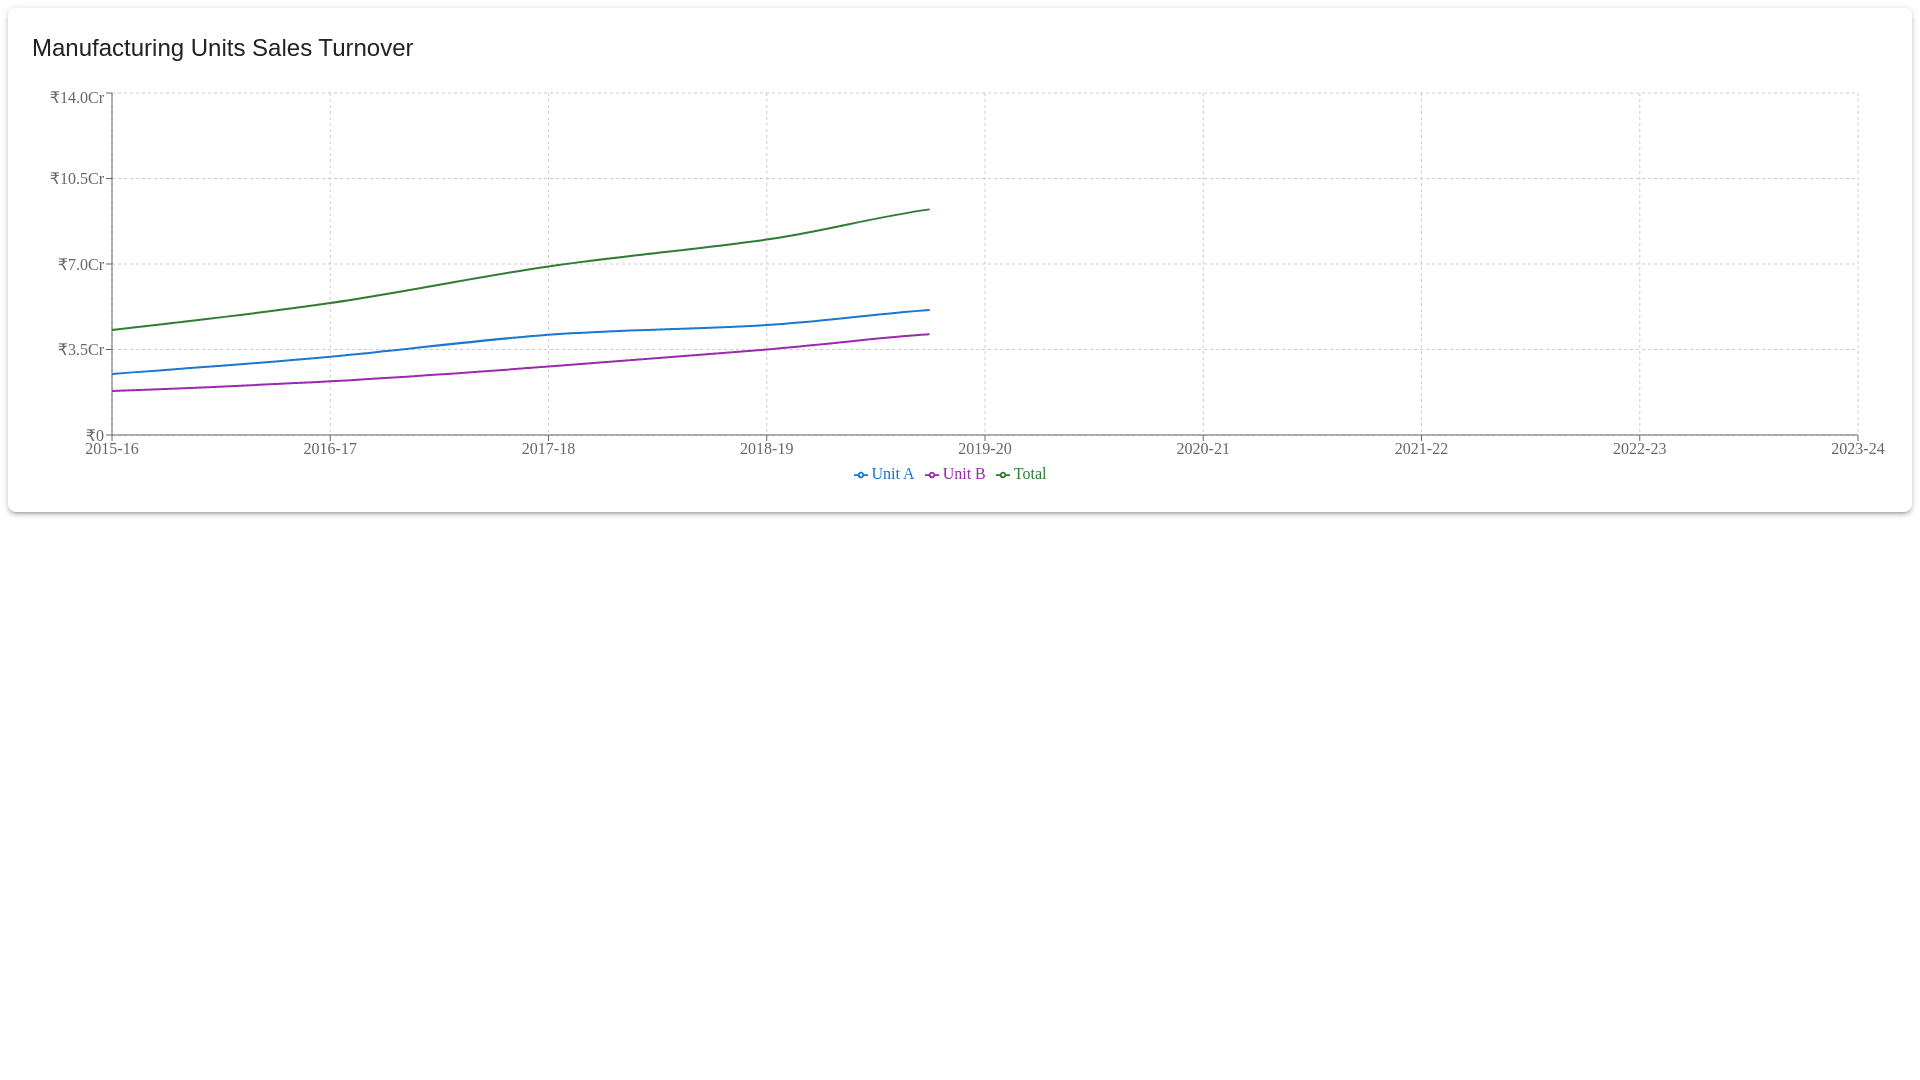
Sales Turnover Graph - Copy this React, Mui Component to your project
Plot graph of company sales turnover per financial year, for each manufacturing unit and total turnover as per data below. there are two units, unit1 and unit2 of manufacturing units: Unit – I Unit – II Total 2015 38,04,22,932 38,04,22,932 2016 52,93,58,877.00 52,93,58,877.00 2017 53,28,80,635.14 1,47,61,410.37 54,76,42,045.51 2018 62,06,19,551.47 15,65,27,765.87 77,71,47,317.34 2019 57,86,20,690.27 17,40,77,802.31 75,26,98,492.58 2020 60,57,09,576.51 24,17,82,184.29 84,74,91,760.8 2021 67,88,89,312.62 35,24,17,391.36 1,03,13,06,703.98 2022 70,54,29,019.77 29,30,66,758.27 99,84,95,778.04 2023 72,42,57,858.12 29,71,86,154.24 1,02,14,44,012.36 2024 45,05,84,784.4 21,99,41,423.85 67,05,26,208.25