Dashboard - Copy this React, Tailwind Component to your project
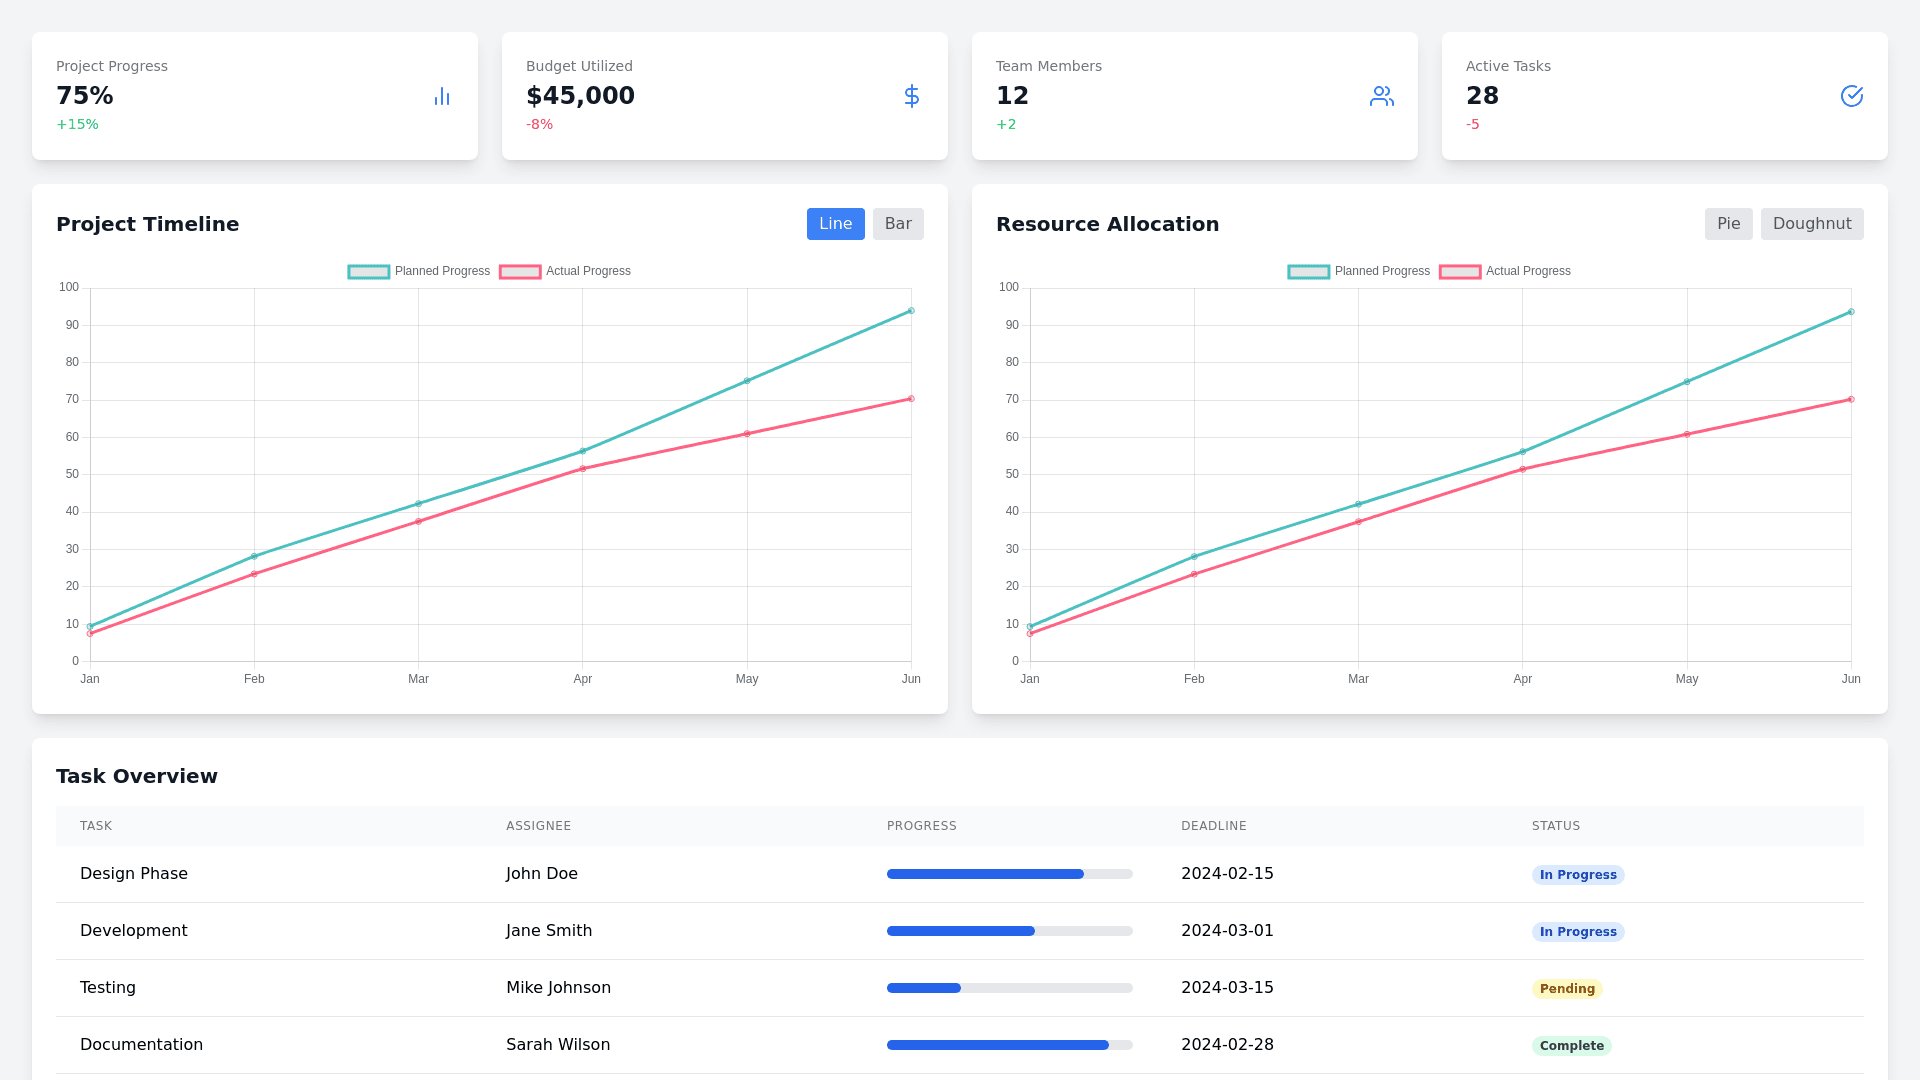
1. Key Metrics and Dashboards Project Overview Dashboard: Project progress (percent complete). Timeline or Gantt chart view. Budget overview (planned vs. actual). Team Performance: Tasks completed by team members. Average task completion time. Pending or overdue tasks. Resource Utilization: Allocation of team members. Resource availability and workload. 2. Task and Project Tracking Task Completion Reports: Status (completed, in-progress, pending). Average task duration. Milestone Reports: Completed vs. pending milestones. Delays and timeline adjustments. Burndown/Burnup Charts: Remaining work over time. Rate of progress (burnup). 3. Time and Budget Analytics Time Tracking: Time spent on specific tasks or projects. Actual vs. estimated time. Budget Tracking: Planned vs. actual costs. Cost overruns and predictions. 4. Risk and Issue Reports Issue Log: Open vs. resolved issues. Categorization by priority or severity. Risk Analysis: Identified risks and mitigation progress. Impact vs. likelihood assessment. 5. Resource Management Analytics Capacity Planning: Utilization rates per resource or team member. Idle or overworked resources. Role-based Analysis: Contribution by roles or departments. 6. Timeline and Milestone Analytics Timeline Trends: Projects meeting deadlines. Average delay per milestone or task. Historical Data Trends: Performance comparison across projects. 7. Client and Stakeholder Reports Custom Reports: Tailored insights for specific stakeholders. Progress Summaries: High-level updates for clients. Detailed reports for internal use. 8. Predictive and Prescriptive Analytics Trend Analysis: Historical trends to forecast completion dates or potential delays. What-If Scenarios: Simulations for different resource allocations or task priorities. 9. Customizable Reports Filters for team members, project types, dates, or specific metrics. Export options (PDF, Excel, CSV).