A
Anonymous
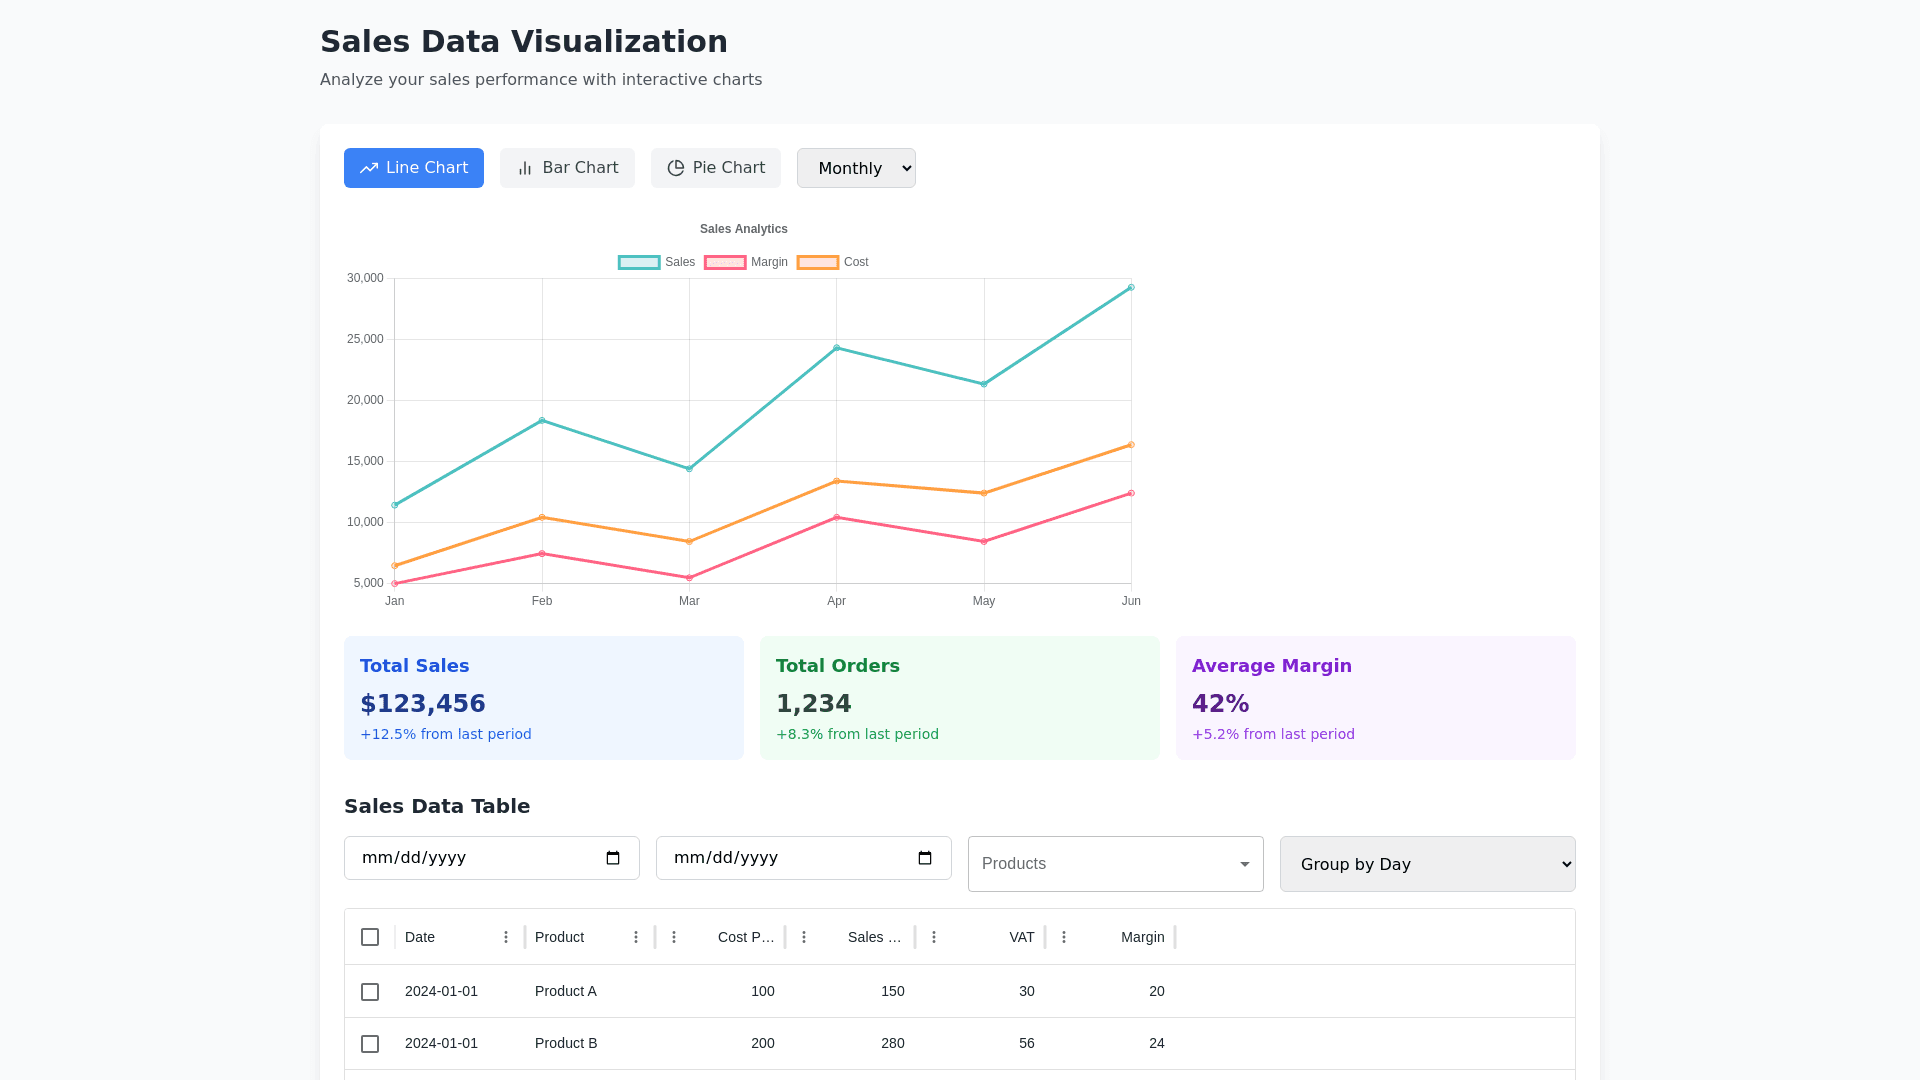
Sales Data Visualization - Copy this React, Tailwind Component to your project
add a datagrid at the bottom that is grouped by day and then product with headers, cost price, sales price, vat, margin. with totals you should be able to group it by day, week, month and year
Prompt