VP
Vikas Pattar
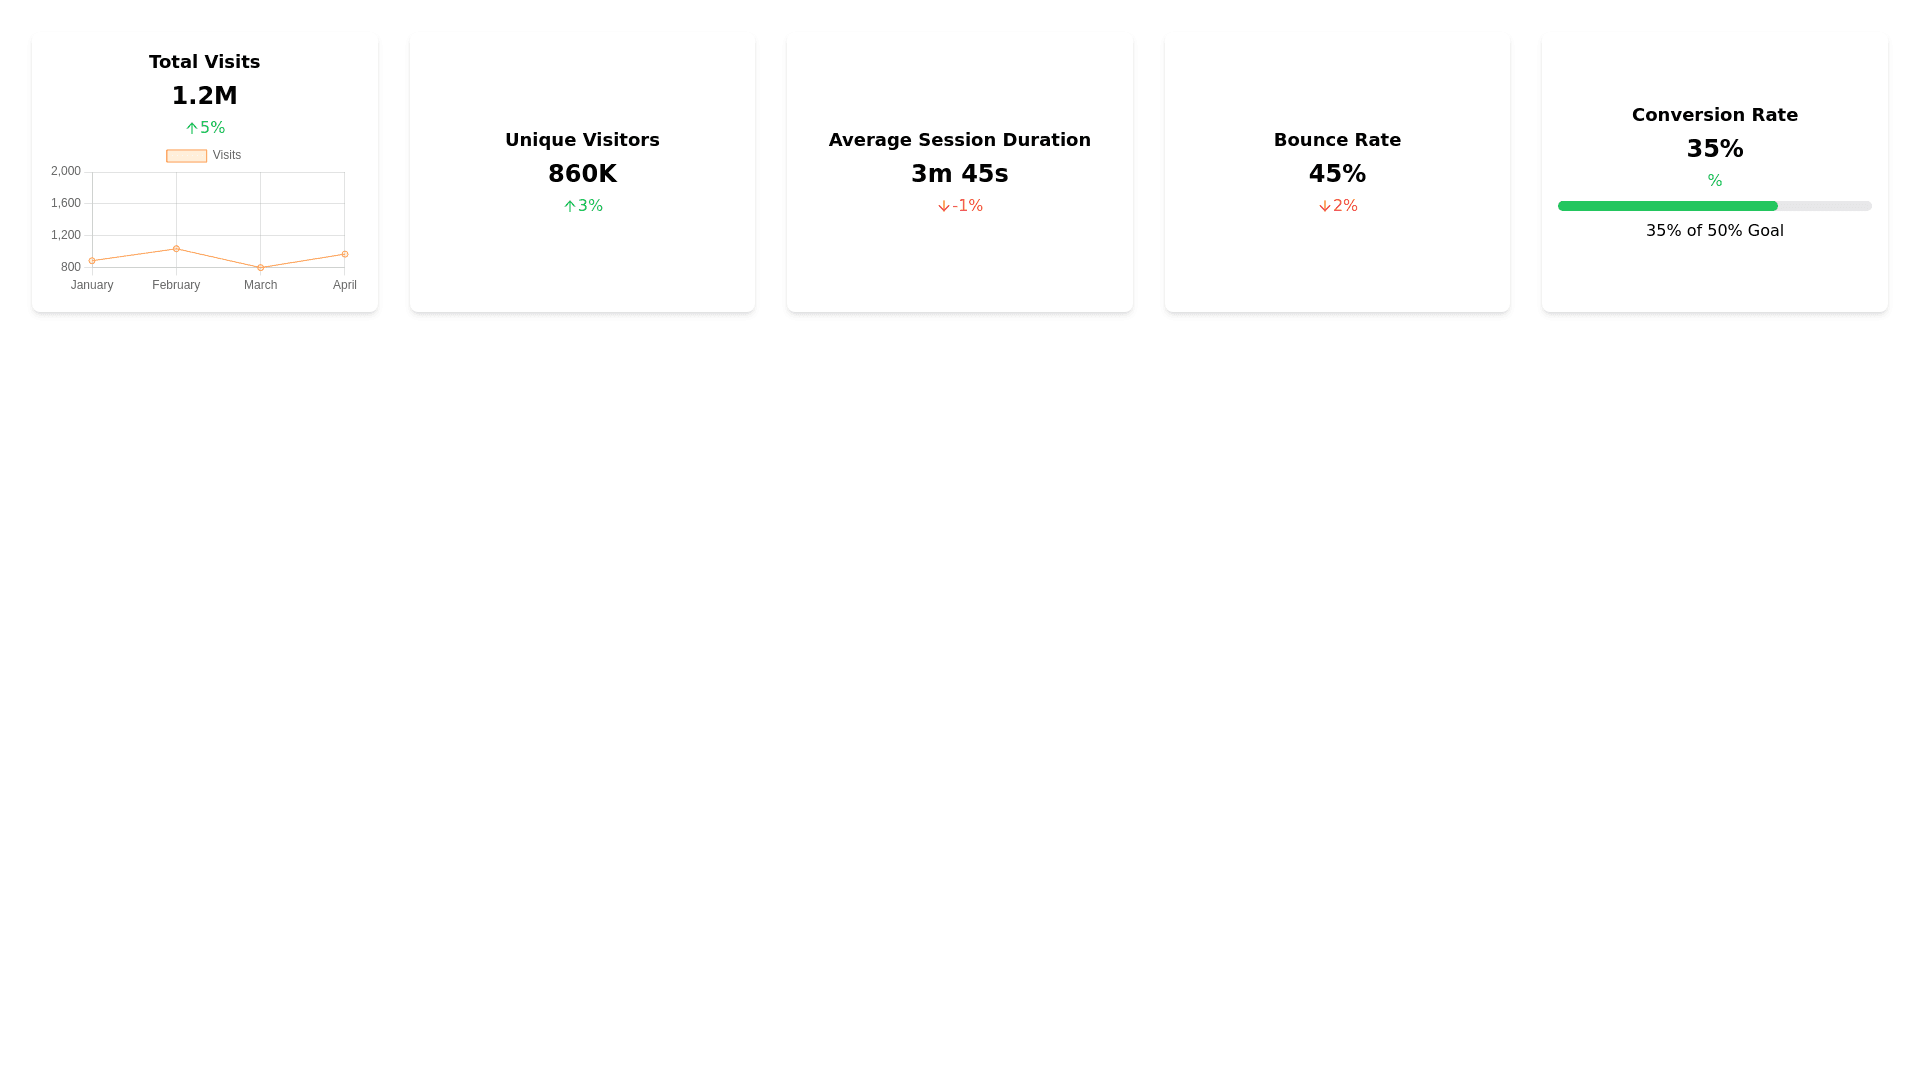
Analytics Stats Component - Copy this React, Tailwind Component to your project
Add visual elements to existing component like line charts to show trends over time, progress bars to indicate goal achievements, and percentage changes compared to the previous period.
Prompt