A
Anonymous
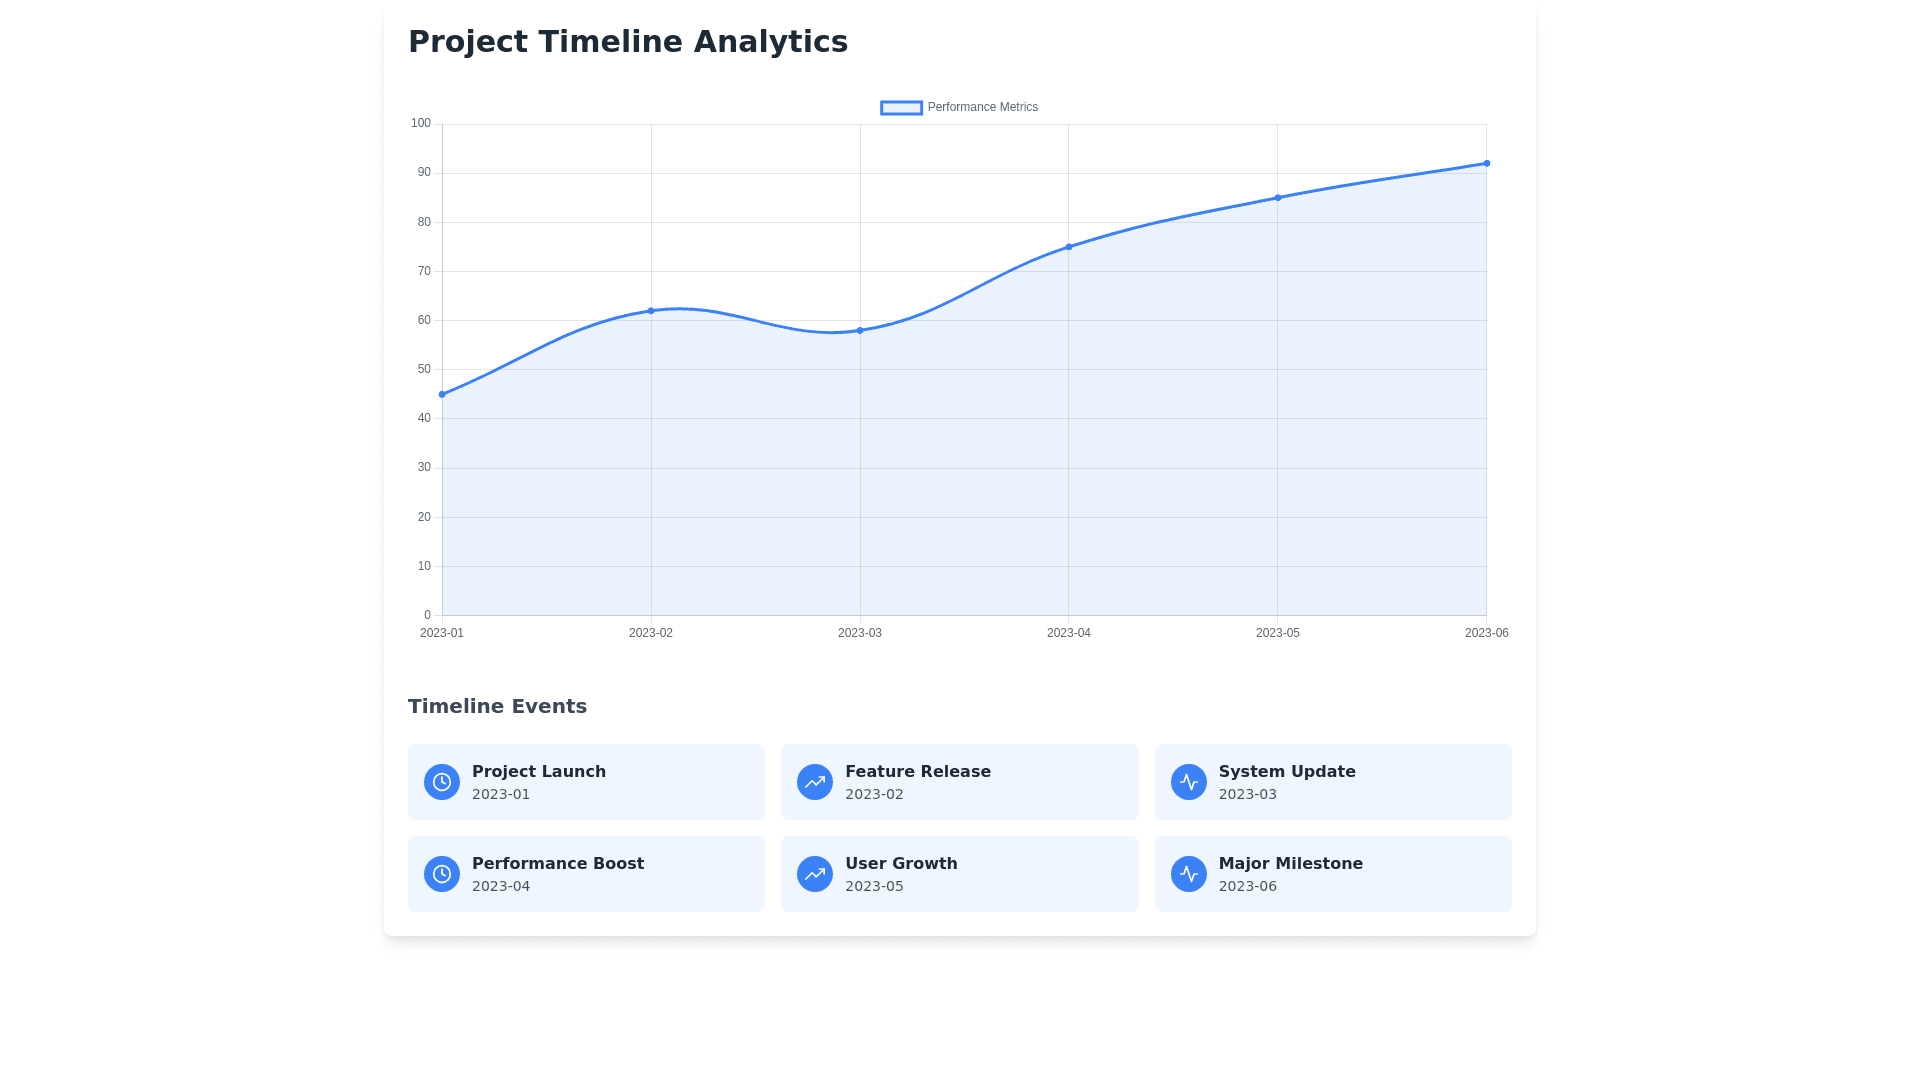
Timeline Data Visualization - Copy this React, Tailwind Component to your project
Use data visualizations like graphs or charts on the timeline to reveal trends or patterns over time.
Prompt
Use data visualizations like graphs or charts on the timeline to reveal trends or patterns over time.