HA
Hamad Adhbiyah
Mock Line Data - Copy this React, Tailwind Component to your project
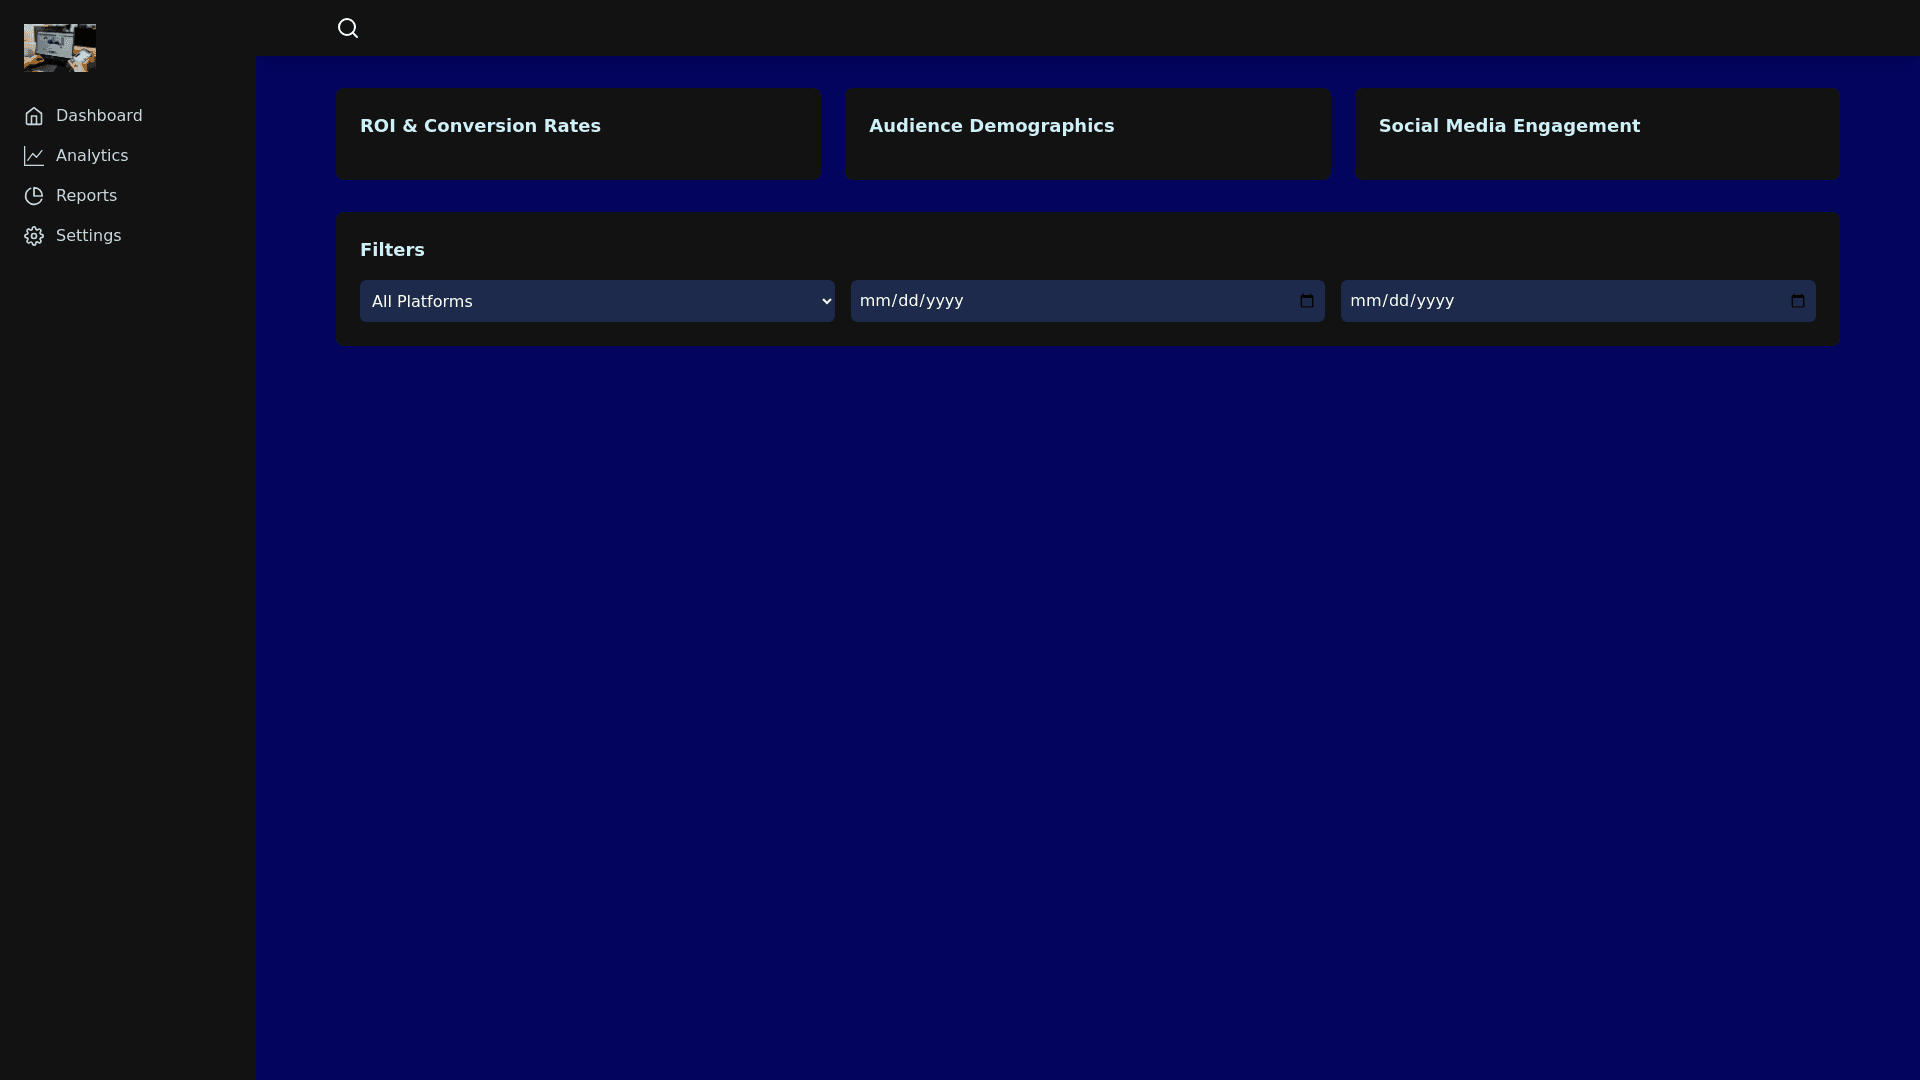
Create a responsive dark themed dashboard for a marketing company with interactive charts like line graphs for tracking ROI and conversion rates, a pie chart for audience demographics which shows data about age, gender and location, and bar charts for social media engagement which shows data of likes and shares and cost analysis. multi pages and login , modal for search and pages with filters and search form
Prompt
