NN
Nam Nguyen
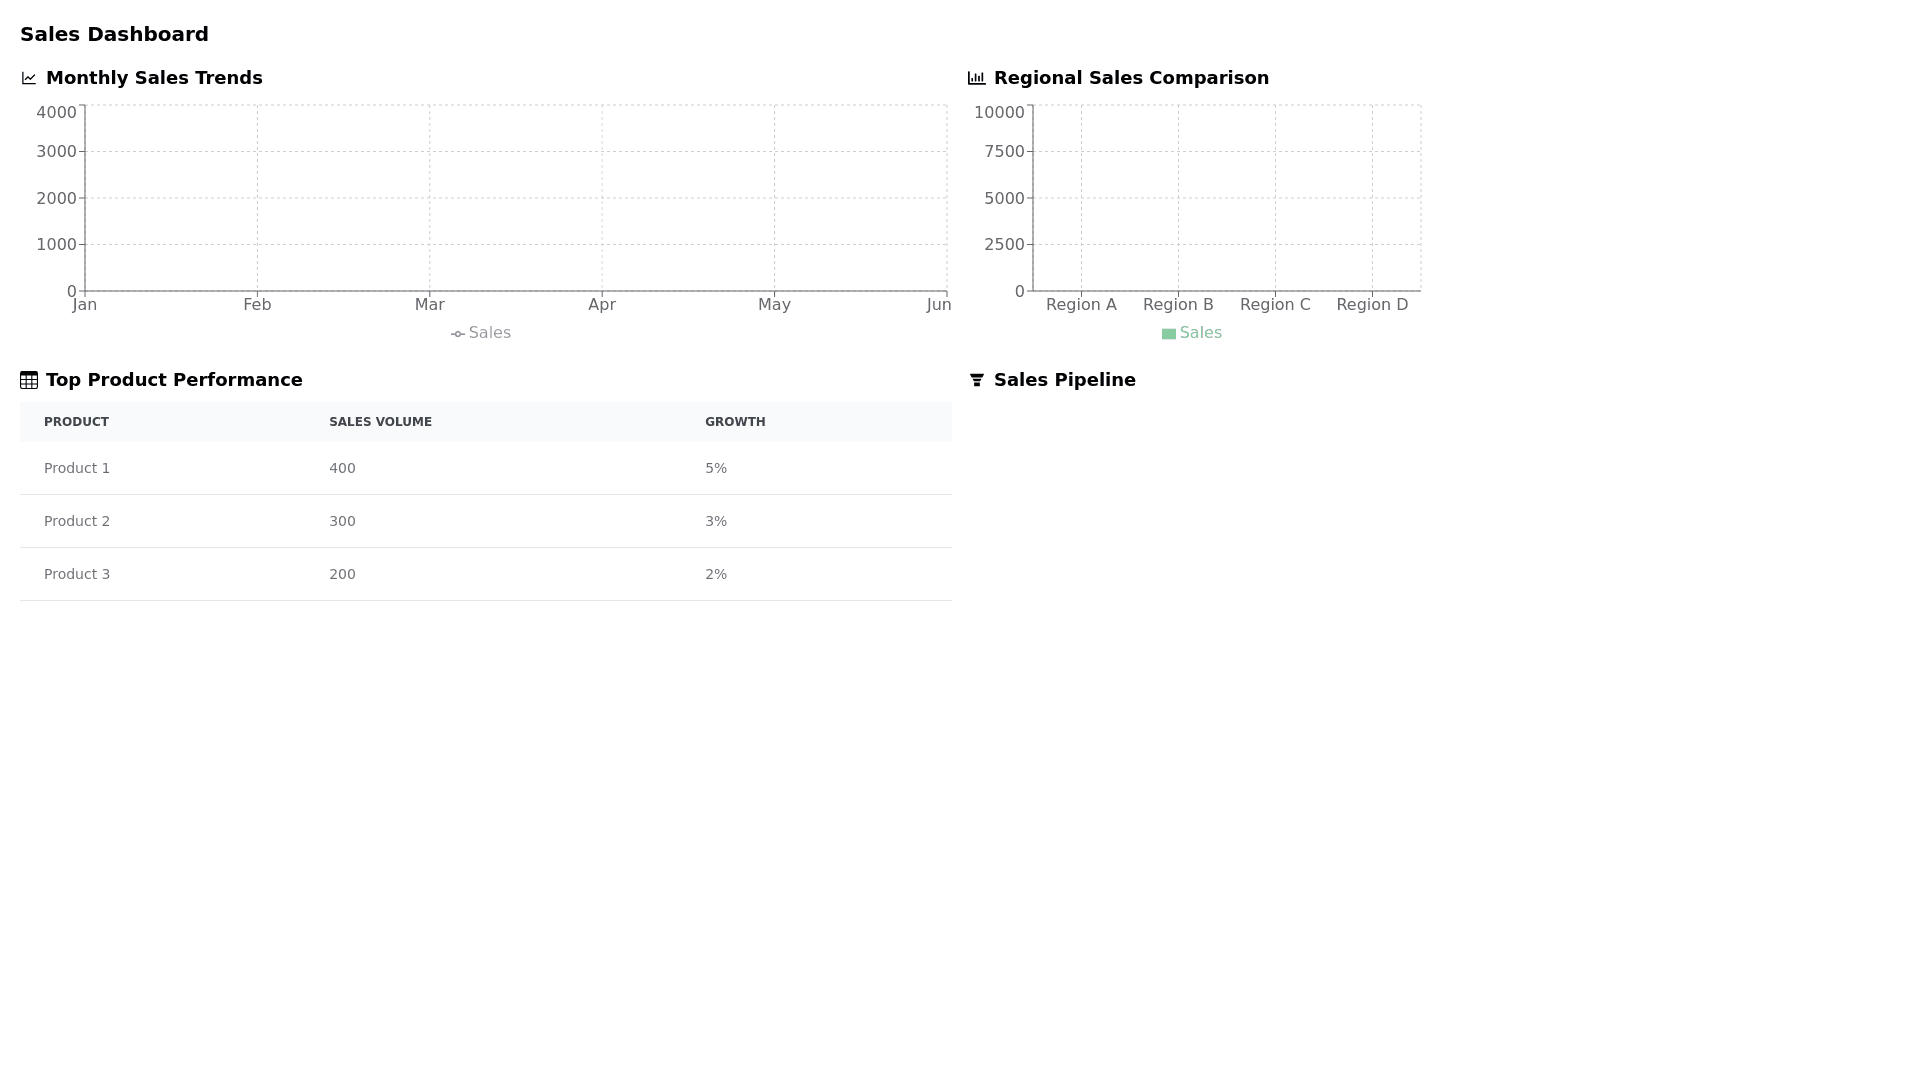
Monthly Trends Graph, Regional Sales Bar Chart, Top Products Table, Sales Pipeline Tracker - Copy this React, Tailwind Component to your project
Design a responsive sales dashboard with monthly trend graphs, regional sales comparisons using bar charts, and tables for top product performance. Include a sales pipeline to monitor conversion rates
Prompt