Revenue Dashboard - Copy this React, Tailwind Component to your project
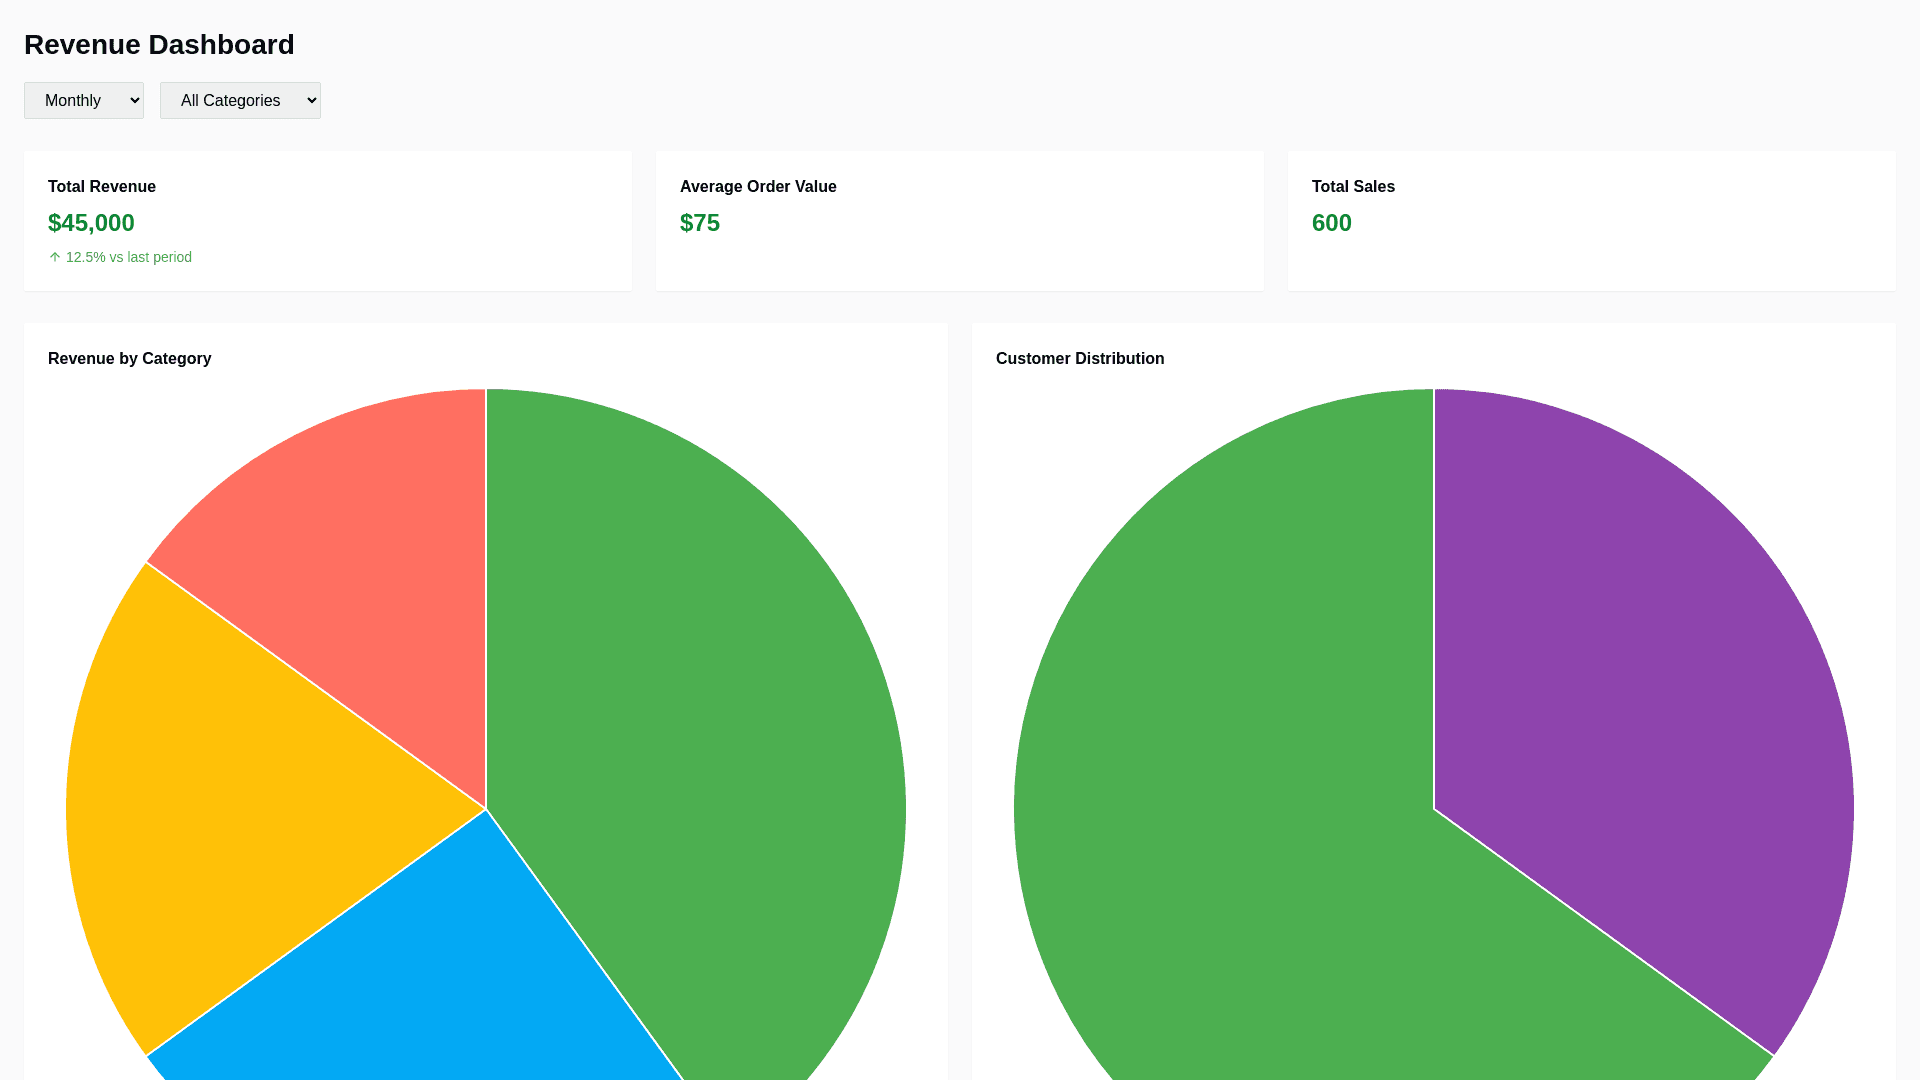
"Design a comprehensive and visually engaging Revenue Reporting Dashboard for a plant store. The dashboard should include: Revenue Overview Section: Total revenue for the current month, quarter, and year. Key performance indicators (KPIs) like average order value, total number of sales, and growth percentage compared to the previous period. Pie Charts: Revenue distribution by product category (e.g., indoor plants, outdoor plants, pots, fertilizers). Percentage of revenue by customer type (e.g., new vs. returning customers). Top Products & Customers Section: Bar charts or tables highlighting the top selling products. A leaderboard of top customers based on purchase frequency or total spending. Sales Data Sheets: Detailed product sales data, including product name, category, unit price, and quantity sold. Customer purchase history, including customer name, contact details, and total spending. Monthly and quarterly revenue summaries. Trends and Insights Section: Line charts showing sales trends over time (e.g., daily, weekly, monthly). Seasonal trends or sales spikes for specific product types. Interactive Features: Filters to view data by date range, product category, or customer group. Drill down functionality to analyze specific products or customer behavior in detail. The dashboard should feature a professional yet eco friendly design, using a green and neutral color palette. Ensure the layout is clean, intuitive, and responsive for both desktop and mobile devices."