VP
Vikas Pattar
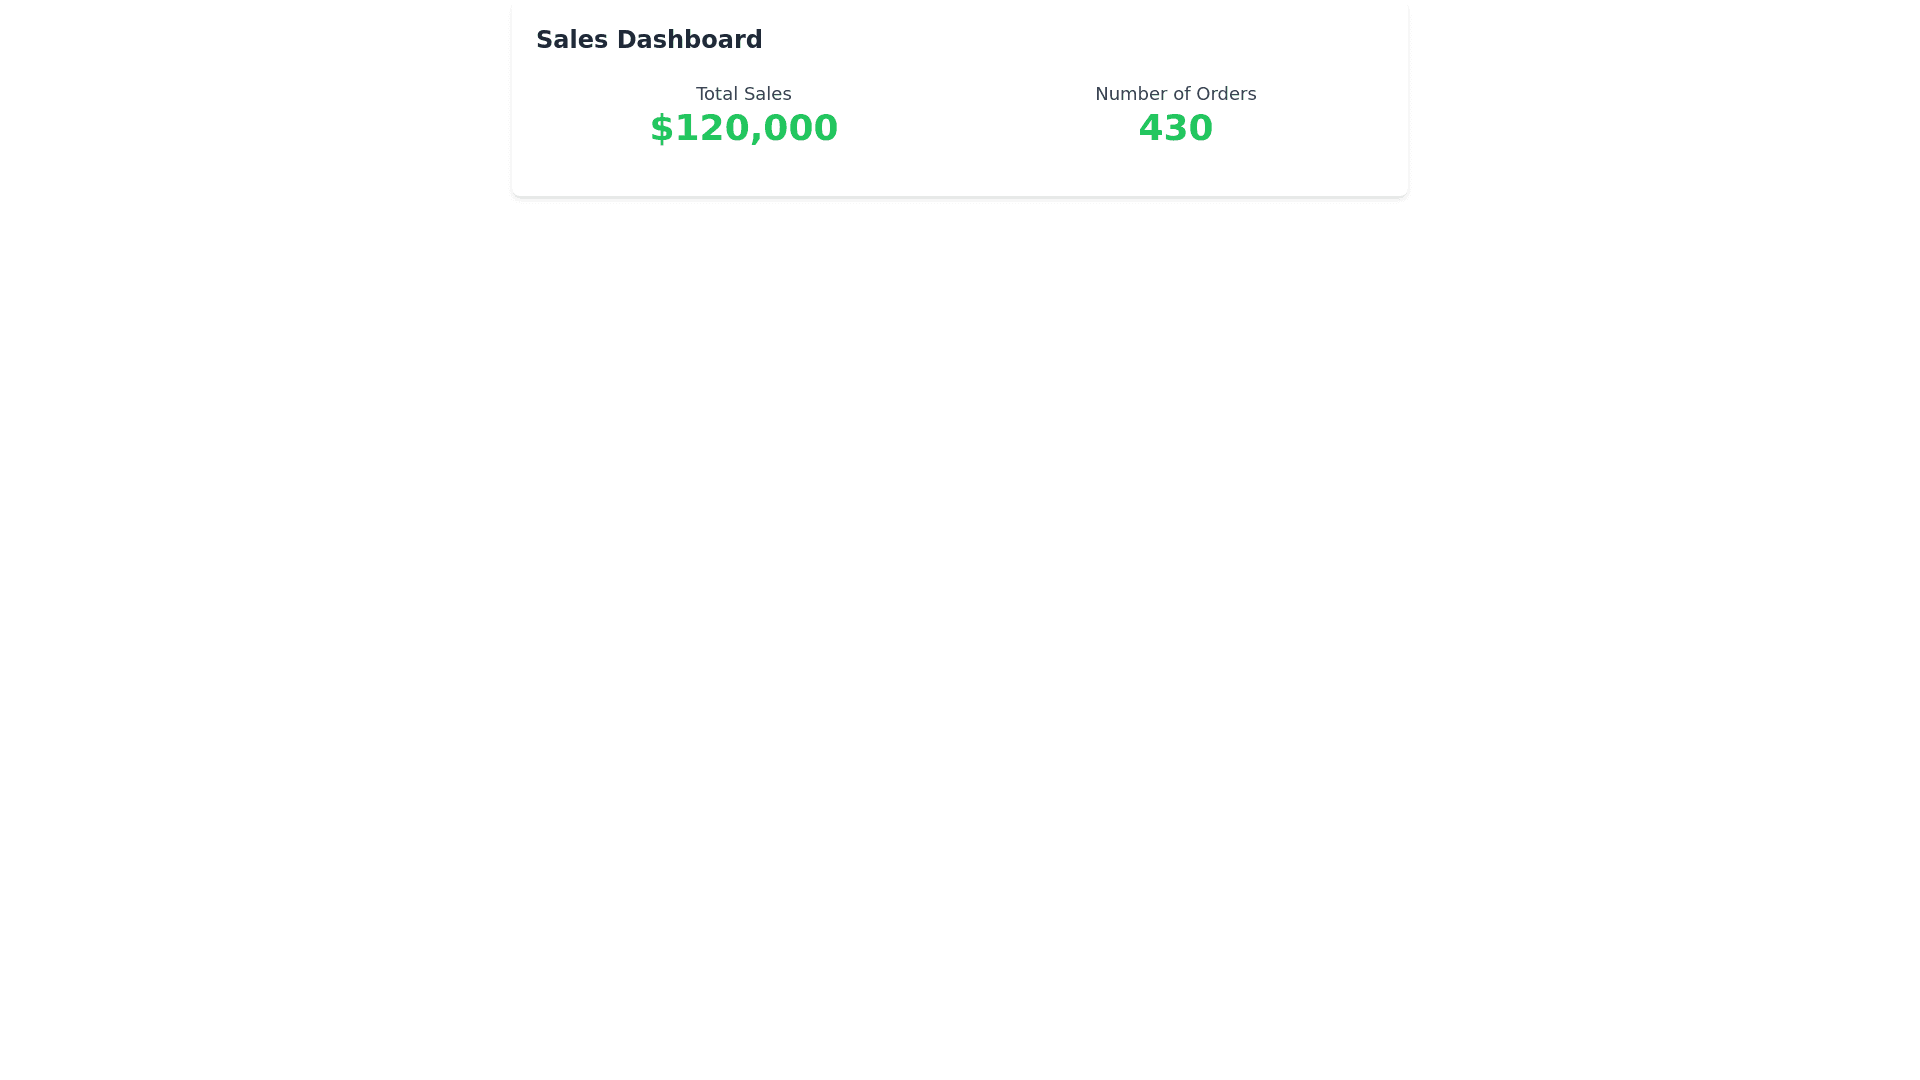
Sales Stats Component - Copy this React, Tailwind Component to your project
Create a stats component for a sales dashboard. The component should display metrics such as total sales, number of orders, average order value, top selling products, and sales by region. Use visual elements like bar charts and pie charts to represent data visually. Include hover effects for detailed tooltips, color coded indicators for performance, and interactive elements like filters to view stats by different time periods e.g., daily, weekly, monthly.
Prompt
