Default Component - Copy this React, Tailwind Component to your project
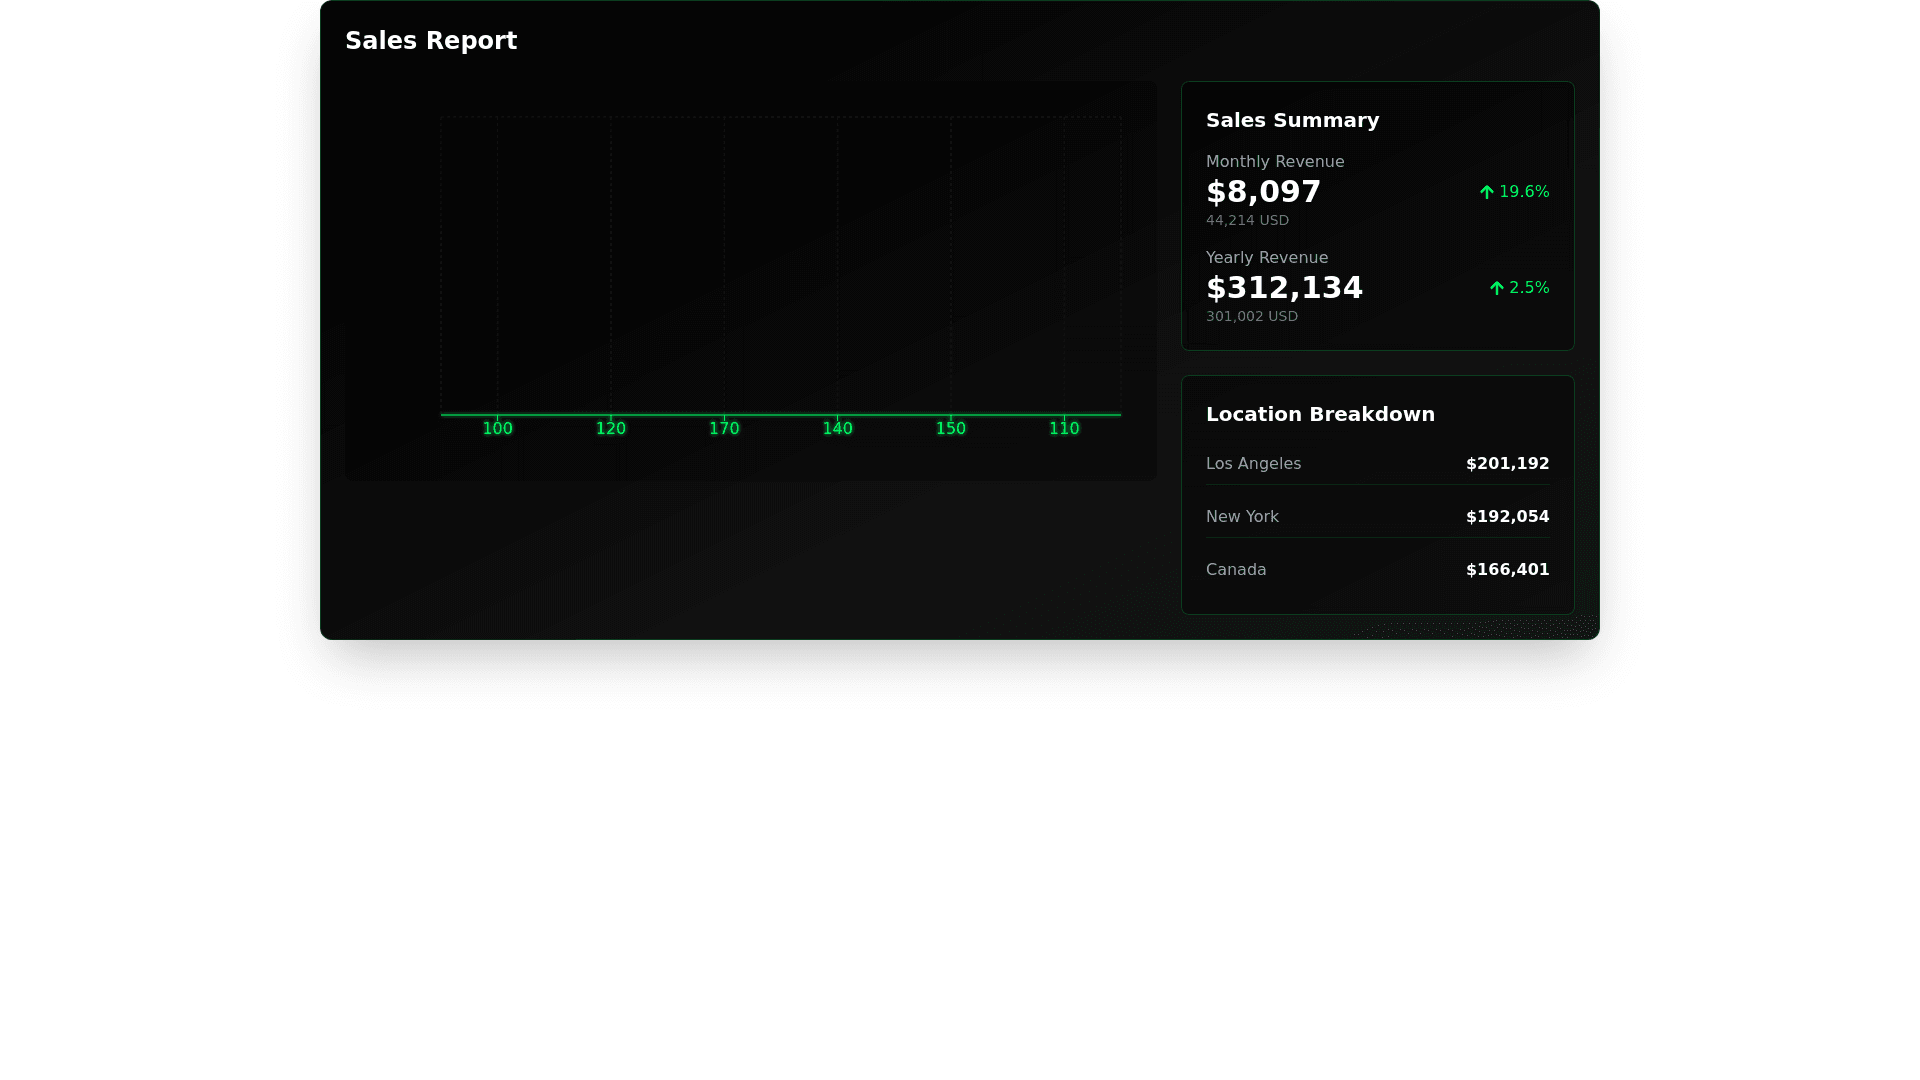
Card Title: "Sales Report" Background & Theme: The card has a dark theme with a black background and a subtle gradient. The text and elements use a neon green and white color scheme for contrast. 3D Graph: At the top, there's a 3D scatter plot with bright green glowing dots, connected to the base grid via vertical lines. The axes of the graph are in a light grid pattern with labeled points. The chart uses a futuristic green glow effect. Financial Data (Key Metrics): Monthly Revenue: Large bold white text: "$8,097" Small green percentage below: "↑ 19.6%" Subtext in small white font: "44.214 USD" Yearly Revenue: Large bold white text: "$312,134" Small green percentage below: "↑ 2.5%" Subtext in small white font: "301.002 USD" Location Breakdown (Table at the Bottom): Column 1: City or Region Column 2: Sales Figures (Right-aligned) Location Sales Value Los Angeles 201,192 New York 192,054 Canada 166,401 Typography & Styling: The title "Sales Report" is in bold white text, slightly larger than the rest of the text. The financial figures are prominently displayed in large, bold font. The percentage changes (green) use an upward arrow to indicate positive growth. The table uses a simple layout with slightly thinner font weights. Card Border & Padding: The card has a subtle rounded border. The content inside is well-spaced with padding.