Dashboard - Copy this React, Tailwind Component to your project
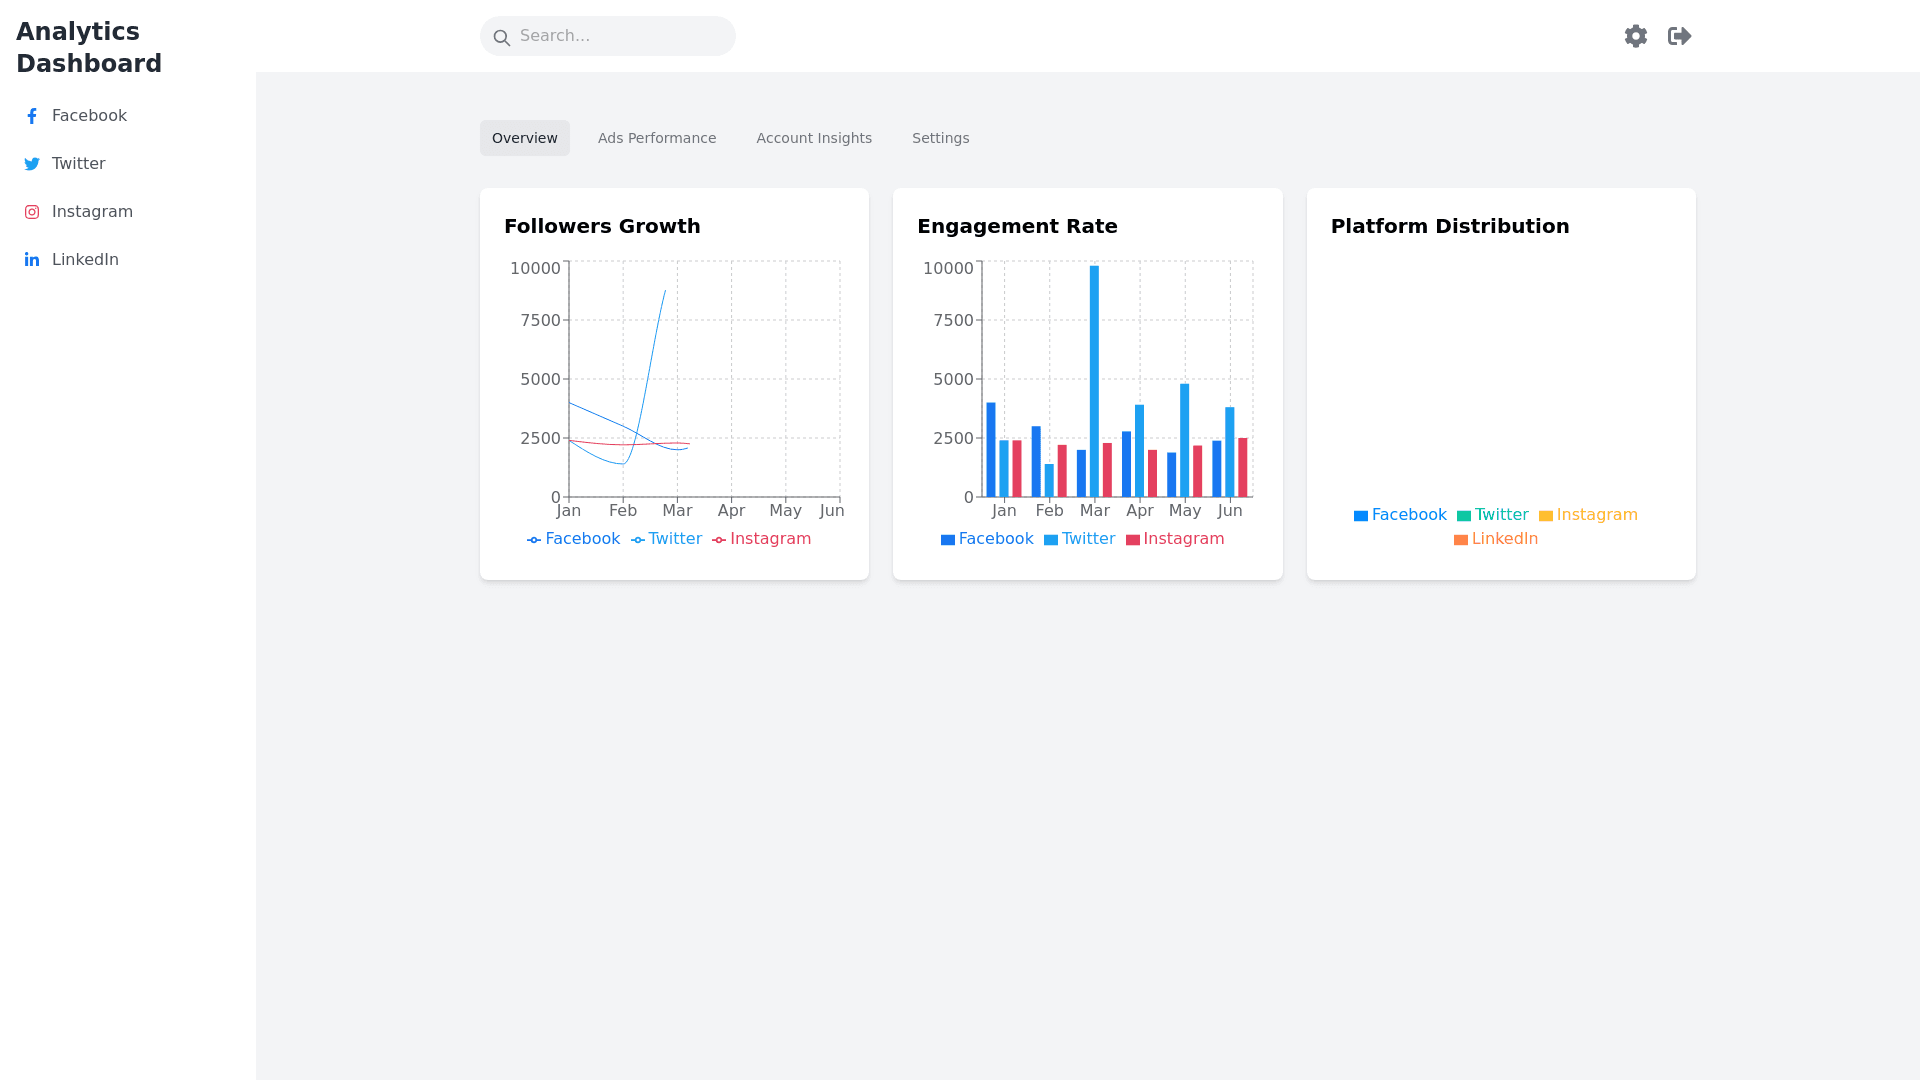
I need a modern dashboard UI for a social media analytics platform. The dashboard should display data from multiple advertising platforms, including Facebook, Instagram, Google Ads, YouTube, Pinterest, and TikTok. The following sections and features are required: Navigation Bar: A top navigation bar with links to 'Overview', 'Ads Performance', 'Account Insights', and 'Settings'. Include a profile icon on the right with user options like 'Log Out' and 'Settings'. Sidebar Menu: A collapsible sidebar with options to filter the data by social media platform (Facebook, Instagram, Google Ads, YouTube, Pinterest, TikTok) and by date range (e.g., last 7 days, last 30 days). Overview Section: Display key metrics such as total clicks, impressions, spend, conversions, and ROI, aggregated across all platforms. Use visually engaging components like large number displays, bar charts, and line charts. Include a dropdown to select specific platforms and update the metrics accordingly. Ads Performance Section: A table showing individual ad performance metrics, including ad name, clicks, impressions, cost per click (CPC), cost per thousand impressions (CPM), and total spend. Provide filters to search by campaign name or ad type, and pagination for long lists. Account Insights Section: Include pie charts or donut charts to show the distribution of ad spend by platform. Line charts for tracking ad performance over time (e.g., spend, clicks, and impressions per day). Allow users to switch between daily, weekly, and monthly views. Detailed Data View: Below the charts, show a detailed data table listing account level insights, such as total followers, reach, engagement rate, and top performing posts for each platform. Include expandable rows to display additional data like post level performance. Settings Section: A settings page where users can connect or disconnect social media accounts, refresh tokens, and manage API credentials for Facebook, Instagram, Google, YouTube, Pinterest, and TikTok. Include toggle switches to enable or disable data collection for each platform. Mobile Responsive Design: Ensure that the dashboard is mobile responsive, with collapsible sections for smaller screens. Charts and tables should adjust dynamically to fit mobile screens. The dashboard design should be clean, modern, and use a color scheme with shades of blue, gray, and white. Use components like buttons, input fields, and dropdowns to allow users to interact with the dashboard. The UI should focus on usability and clean data visualization.