SP4
Surya Peddireddy 420
Styled Card - Copy this React, Mui Component to your project
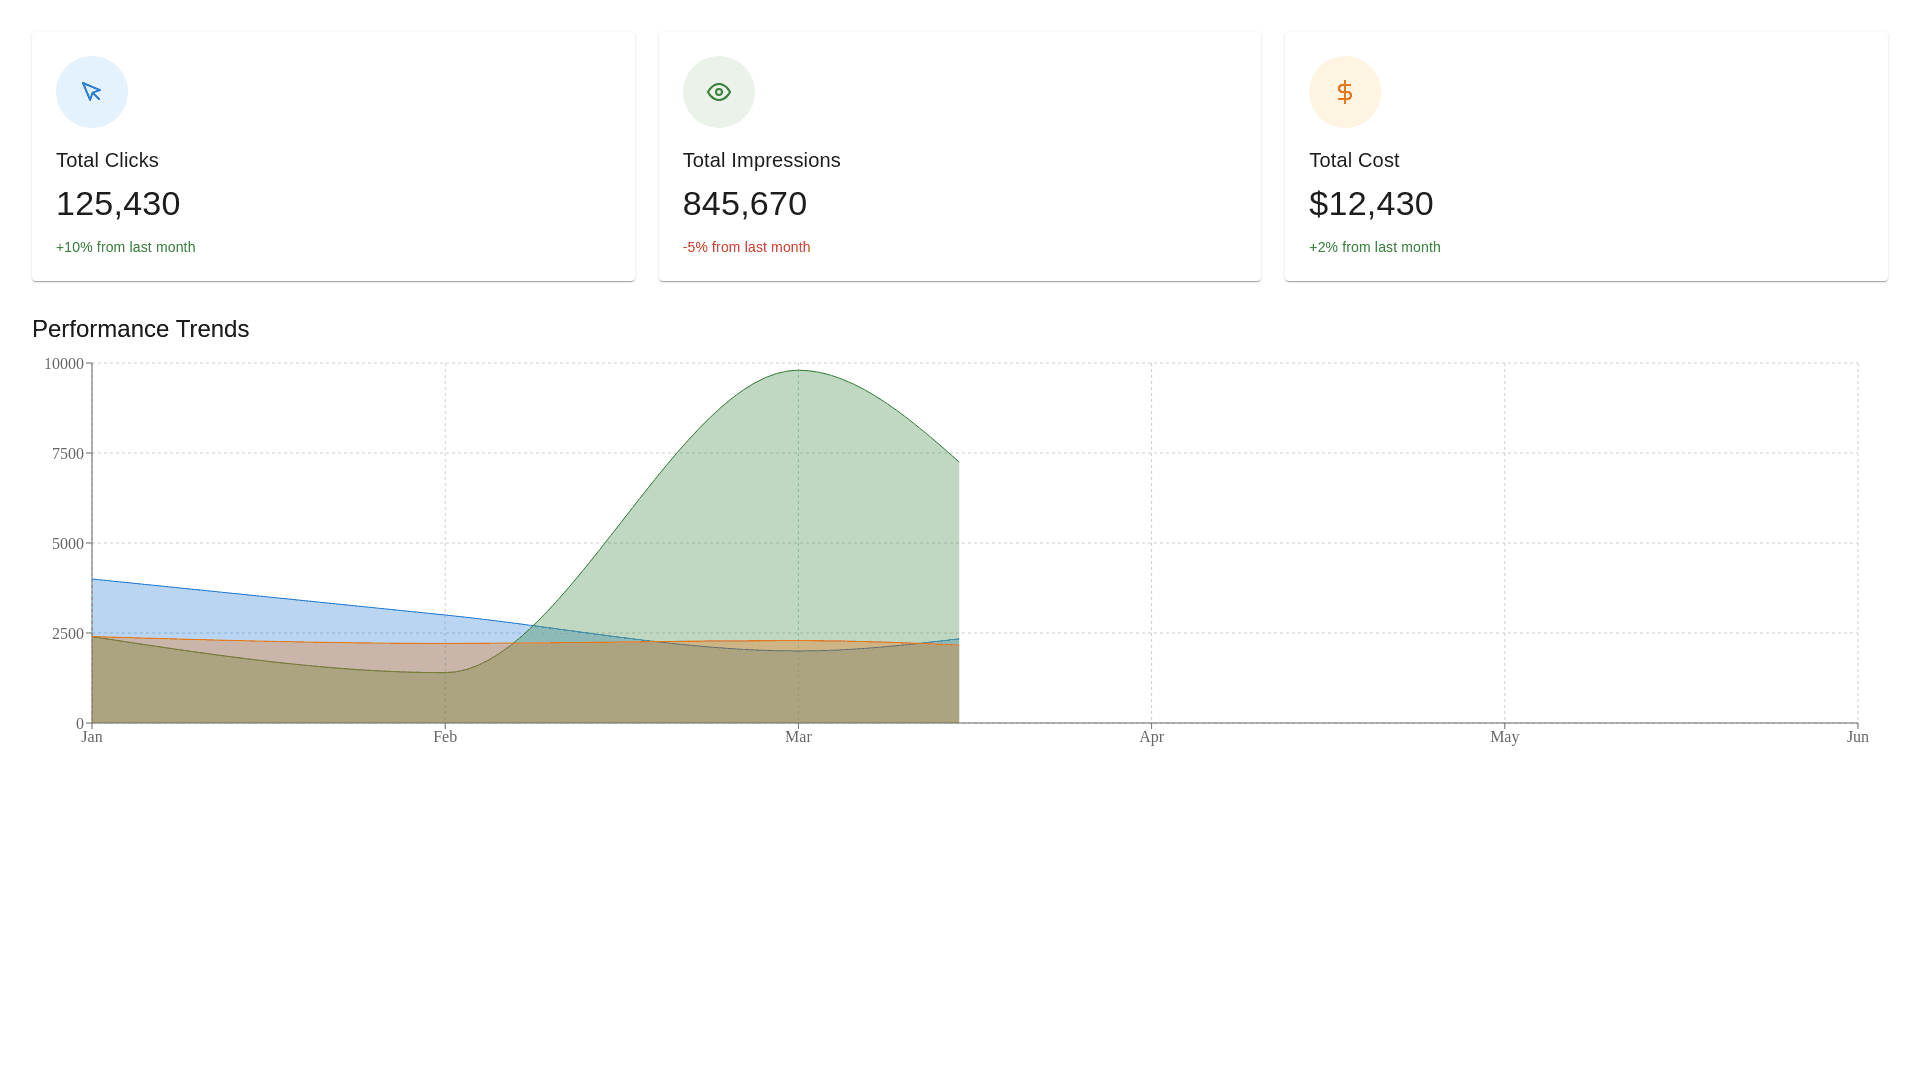
Create a responsive statistics component with three cards in the first row displaying total clicks, impressions, and cost, each with an icon, data, and percentage change. Below, add an area chart with a related heading and data.
Prompt