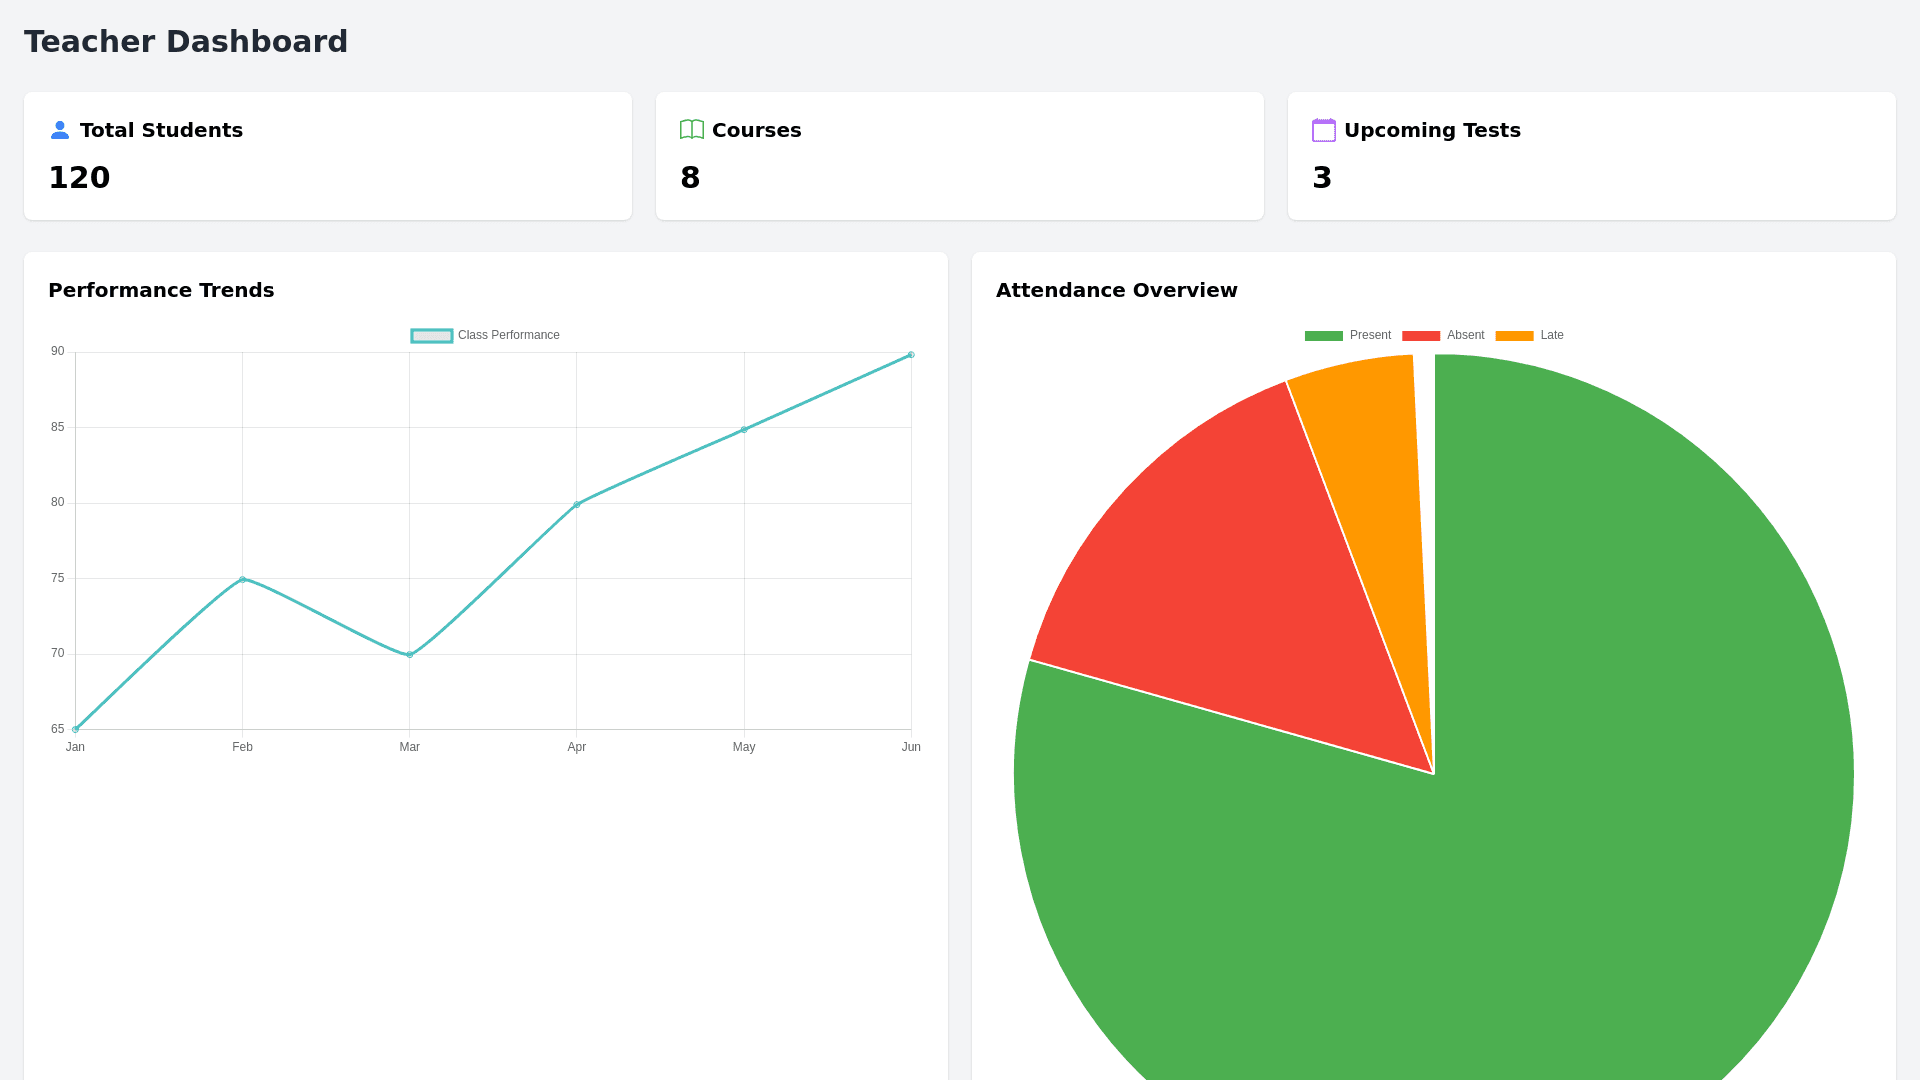
Teacher Dashboard - Copy this React, Tailwind Component to your project
Local hosted application: To create a more robust set of reports and features for your educational website, we can expand the current features to provide deeper insights and enhanced usability for both teachers and students: Teacher Dashboard Features Advanced Question Analysis: Distractor Analysis: Identify common incorrect answers and understand if certain options were misleading. This helps in refining the quality of questions. Difficulty and Discrimination Index: Include metrics such as the difficulty index (how hard the question was) and discrimination index (how well the question differentiates between high and low performing students). Comparison Across Classes: Compare how different sections or classes performed on similar questions to identify if specific teaching methods are more effective. Student Performance Reports: Growth Tracking: Track students’ growth over time across different assessments, showing trends in their learning and identifying consistent areas of struggle. Peer Comparison: Include anonymized comparisons to show where a student stands relative to their peers, helping teachers and parents better understand their performance. Automatic Skill Gap Identification: Highlight specific topics or concepts that a student consistently struggles with, along with suggestions on what can be done to improve these areas. Actionable Insights for Teachers: Instructional Recommendations: Provide tailored teaching strategies or remedial activities for groups of students with similar weaknesses. Intervention Alerts: Generate alerts for students falling behind consistently, indicating the need for an intervention plan. Teacher Effectiveness and Feedback: Performance Analytics: Correlate student performance with individual teacher effectiveness, considering their assigned subjects. This allows evaluation of instructional success. Evaluation Reports: Offer detailed reports that include teacher evaluations, feedback, and suggested improvements for their teaching strategies. Training Program Reports: Participation Metrics: Track teacher participation in training sessions and evaluate their impact on classroom outcomes. Skill Development: Assess the improvement in teaching skills after attending workshops, correlating it with student outcomes to gauge effectiveness. Customizable Reports: Drag and Drop Report Builder: Allow teachers to create custom reports with selected metrics, including filters for students, classes, assessment types, etc. PDF and Word Export: Export reports with graphs, suggestions, and insights in multiple formats, making sharing and archiving easier. Student Dashboard Features In Depth Analysis for Students: Strengths and Weaknesses by Topic: Highlight areas where the student has consistently performed well and the areas that need improvement, broken down by specific curriculum topics. Study Recommendations: Offer specific study plans with resources such as video links, worksheets, or activities tailored to the student’s weak areas. Goal Setting and Tracking: Personal Learning Goals: Enable students to set specific goals for improvement (e.g., "Improve science score by 10% in the next term") and track their progress over time. Progress Milestones: Display milestones achieved, keeping students motivated with gamified achievements or badges. Interactive Performance Visualization: Progress Graphs: Use interactive graphs to show historical performance, allowing students to visually track their progress over time. Question by Question Breakdown: Allow students to see how they answered each question compared to peers and provide instant feedback for wrong answers. Custom Learning Paths: Personalized Activities: Based on performance, provide practice questions and real life activities to help students strengthen weak concepts. Adaptive Learning Recommendations: Suggest digital learning tools or games that adapt to the student's current level to help bridge knowledge gaps. Self Reflection Opportunities: Post Assessment Reflections: Allow students to reflect on their performance after each assessment, noting areas they felt confident or struggled with. This can help improve self awareness and ownership of their learning. Administrative and Reporting Features Consolidated Data Management: Unified Data Access: Centralize all student and assessment data, including attendance, participation in extracurriculars, and performance metrics. Role Based Access Control: Provide different views and access permissions based on user roles (e.g., teacher, administrator, student). Trend Analysis and Predictive Insights: Performance Trends: Use machine learning models to identify trends and predict future performance, helping administrators take proactive measures. At Risk Student Identification: Automatically flag students who are at risk of falling behind based on their performance patterns. Holistic Reports for Parents: Comprehensive Reports: Provide reports that offer a holistic view of the student's performance, including academic results, skill development, and extracurricular activities. Engagement Suggestions: Include suggestions for parents on how they can support their child's learning at home. Workshop and Training Evaluation: Post Training Feedback: Evaluate the effectiveness of teacher workshops and training sessions, using surveys and analyzing how the training has impacted teaching quality and student outcomes. Technical Implementation Considerations Data Analytics Backend: Use a robust backend system, possibly utilizing Python or R, to process assessment data and generate insightful metrics. Visualization Tools: Integrate libraries like Chart.js or D3.js for dynamic and interactive visualizations to enhance the teacher and student experience. Automated Reporting: Automate the report generation process using tools like Apache PDFBox (for PDF) or custom templates for Word, avoiding docx as you planned.
