Urban Observatory Dashboard - Copy this React, Tailwind Component to your project
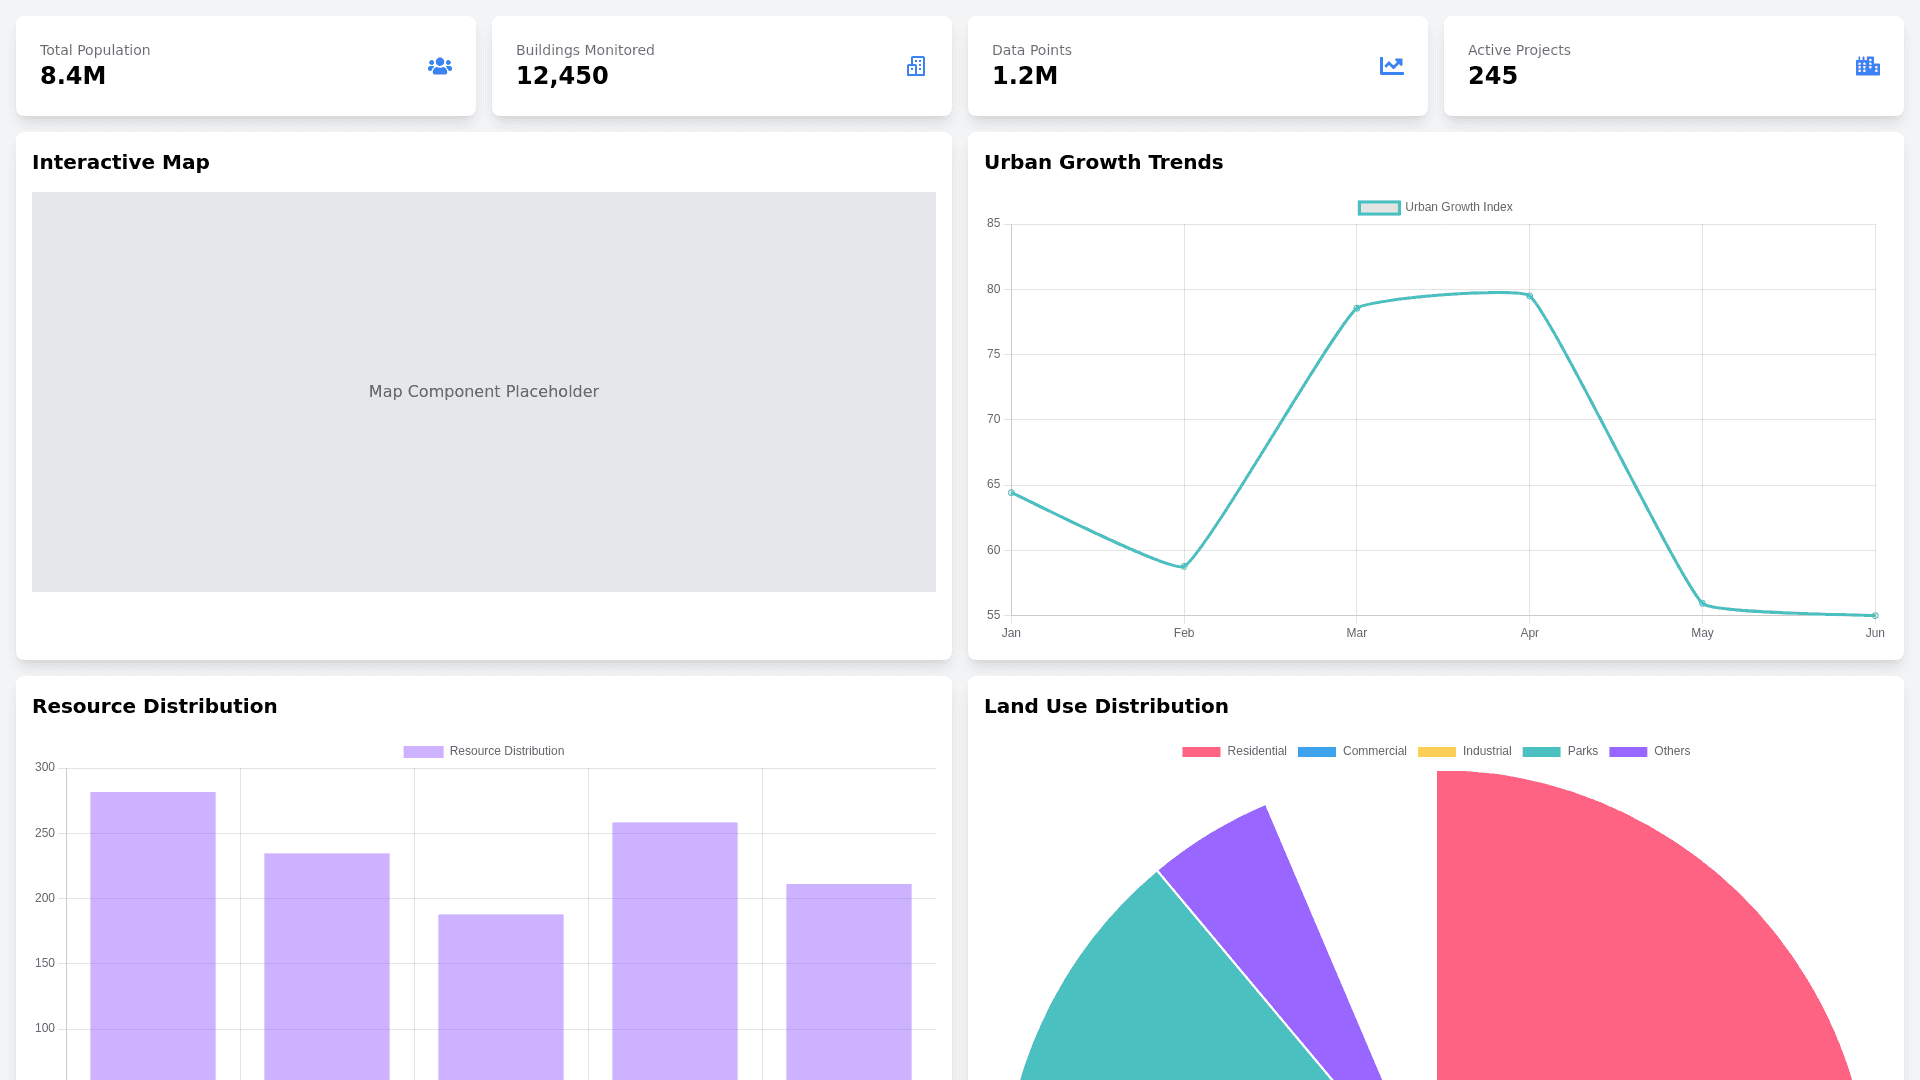
Creating a dashboard for an Urban Observatory for Institutional Linkage involves gathering, visualizing, and analyzing key urban data to facilitate collaboration between institutions like universities, government agencies, and research organizations. Here’s a breakdown of what to include: 1. Key Sections of the Dashboard: • Overview/Executive Summary: • Key metrics at a glance (e.g., air quality, population density, traffic flow). • Alerts or notable trends. • Interactive Map: • Real time data layers (e.g., pollution levels, infrastructure projects). • Geographic Information System (GIS) integration for spatial analysis. • Data Analytics & Trends: • Historical data trends (population growth, economic indicators). • Predictive analytics (e.g., urban expansion forecasts). • Collaboration & Institutional Data: • Active projects across institutions. • Shared resources (e.g., research papers, datasets). • Policy Impact & Recommendations: • Insights into how data affects policy decisions. • Policy recommendations based on data analysis. 2. Key Metrics to Track: • Environmental Data: • Air and water quality. • Noise pollution levels. • Green spaces and urban heat islands. • Socioeconomic Data: • Population demographics. • Employment rates and economic output. • Public health statistics. • Urban Mobility: • Traffic congestion and flow. • Public transportation usage. • Pedestrian and cyclist data. • Infrastructure & Urban Development: • Real estate development and zoning. • Utility usage (water, electricity). • Smart city initiatives. • Institutional Engagement: • Active partnerships. • Ongoing research projects. • Funding and grant status. 3. Data Visualization Elements: • Heat maps and choropleth maps for spatial data. • Line graphs and bar charts for trends over time. • Pie charts and treemaps for resource allocation. • Real time dashboards with dials and gauges for dynamic data. 4. User Interaction & Features: • Customizable Views: Allow users to filter by geography, time, or data type. • Data Upload & Download: Enable data sharing between institutions. • Notifications & Alerts: Send updates on critical thresholds or project milestones. • Collaboration Tools: Commenting, tagging, and document sharing. 5. Technological Integration: • APIs for Real time Data Feeds: Connect to sensors, government databases, etc. • Machine Learning Models: For predictive analytics. • Interoperability: Ensure compatibility with institutional data systems. 6. User Roles & Permissions: • Role based access (e.g., researchers, policymakers, public users). • Data privacy and security protocols. 7. Sustainability & Inclusivity Focus: • Highlight progress toward sustainability goals (e.g., SDGs). • Equity focused data (e.g., accessibility to public services).