Dashboard - Copy this React, Tailwind Component to your project
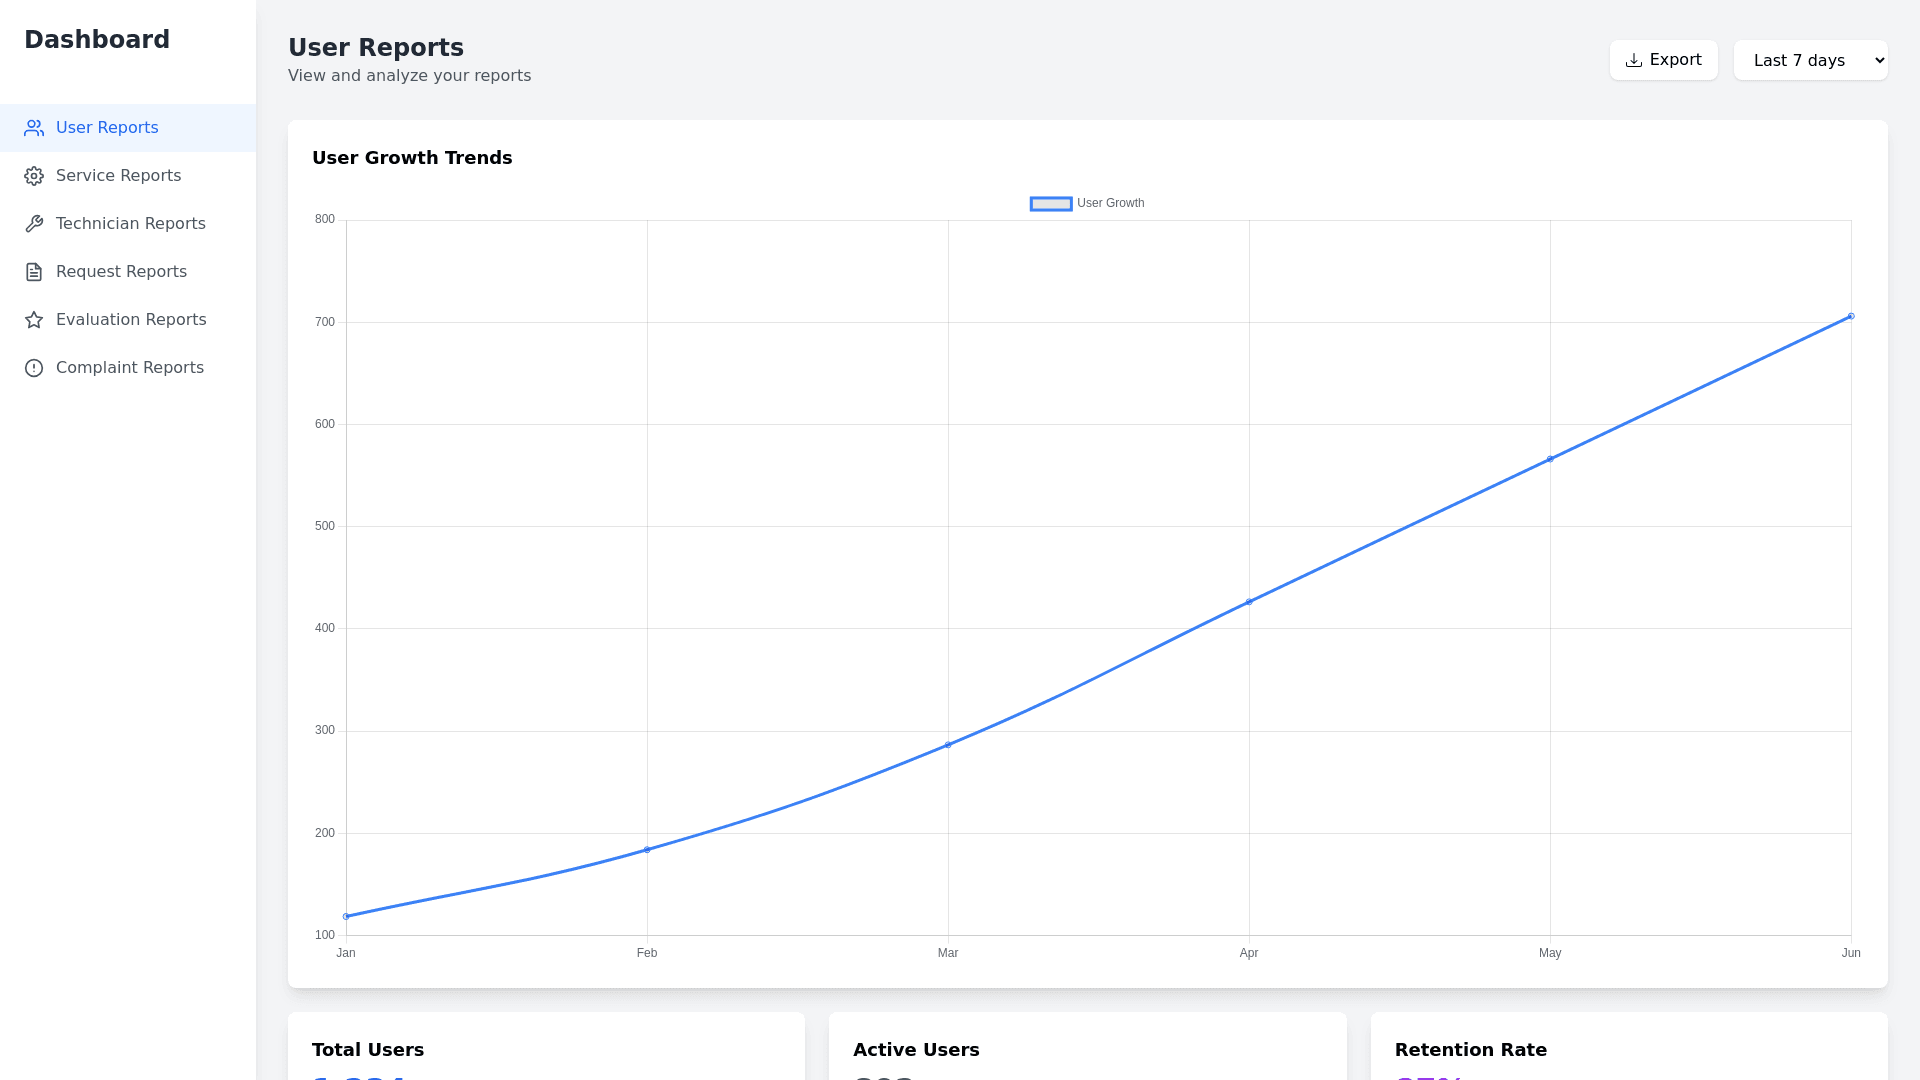
1. User Reports Purpose: Provide insights into user behavior, demographics, and engagement metrics to help optimize user experience. Key Data Points: Total active users User registration trends (daily/weekly/monthly) Geographic distribution of users User segmentation (e.g., age, service usage, etc.) User retention and churn rate Layout Recommendations: Top Section: Interactive graph for user growth trends. Middle Section: Pie chart showing geographic/user segmentation. Bottom Section: Summary cards with key statistics. 2. Service Reports Purpose: Track and analyze the performance of services offered through the platform. Key Data Points: Number of services completed/ongoing Average service rating Most requested services Service success rate Layout Recommendations: Top Section: Horizontal bar chart for service category usage. Middle Section: Table of top performing services with ratings and counts. Bottom Section: Line graph for service success trends. 3. Technician Reports Purpose: Evaluate technician performance and their contribution to service delivery. Key Data Points: Technician availability status Number of services completed per technician Technician ratings and reviews Average response time per technician Layout Recommendations: Top Section: Heatmap for availability and response times. Middle Section: List view for technician performance metrics. Bottom Section: Drill down for individual technician reports. 4. Request Reports Purpose: Summarize and track customer service requests to ensure timely handling and completion. Key Data Points: Total requests (completed/pending) Average resolution time Request category distribution Pending requests per technician or team Layout Recommendations: Top Section: Dashboard with request status breakdown. Middle Section: Donut chart for category distribution. Bottom Section: Detailed table for pending requests with filters. 5. Evaluation Reports Purpose: Assess customer satisfaction and service quality based on evaluations. Key Data Points: Customer satisfaction scores (CSAT) Evaluation submission trends Common feedback themes Positive vs negative feedback ratio Layout Recommendations: Top Section: Satisfaction trend graph (CSAT). Middle Section: Word cloud or summary of feedback themes. Bottom Section: Rating distribution bar chart. 6. Complaint Reports Purpose: Analyze complaints to address issues and improve service delivery. Key Data Points: Number of complaints received/resolved Complaint category analysis Average resolution time for complaints Recurring complaint themes Layout Recommendations: Top Section: Real time counter for complaints (resolved/pending). Middle Section: Pie chart for complaint categories. Bottom Section: Timeline for average resolution time trends. Additional Features for All Reports: Filter Options: Date range, user groups, or service types. Export Options: Download as PDF or Excel. Interactive Elements: Clickable graphs for deeper analysis. Notifications: Automated alerts for key metrics (e.g., overdue complaints).